While the various report designers in Progress Telerik Reporting will let you do magical things, in the end, your report is saved as a TRDP file (essentially an XML document) that describes your report declaratively and, potentially, served from your organization’s Report Server (which I’ve assumed in this post).
But Telerik reports are also inherently interactive. You can, for example, in any of the Report Designers, create a report that allows the user to pick the data they want to see (either by explicitly selecting a filter in the report’s UI or by selecting items displayed in the report). And, with the Report Designer, you do that declaratively, without code, using drag-and-drop and setting report options.
But the next step in interactive reports is to have your report interact with the page that’s hosting the report. That interaction can take two forms by having the:
- Page hosting the report respond as the user interacts with the form
- Report respond as the user interacts with the host page
While implementing either of these interactions does require code, you start the process off declaratively.
Setting Up
For this post, I’m using this combination of HTML and JavaScript to set up a:
- HTML
divelement to hold a report - HTML
styleelement with CSS attributes to control the report’s appearance - JavaScript reference to the
divelement id - A JavaScript function (called
loadReport) that displays a modified version of one of the sample reports that comes with the Telerik Report Server
That all looks like this:
<div id="dashboard">
    loading...
</div>

<style>
      #dashboard {
          position: absolute;
          left: 5px;
          right: 5px;
          top: 5px;
          bottom: 5px;
          overflow: hidden;
          font-family: Verdana, Arial;
      }
  </style>
<script>
const dashboardDiv = $("#dashboard");

const loadReport = () => {
     dashboardDiv.telerik_ReportViewer({
         reportServer: {
             url: "http://...",
             username: "…",
             password: "…"
         },
         reportSource: {
             report: "Samples/Dashboard"
         }
     });
};
</script>
As my loadReport function shows, loading a report is essentially declarative. To display the report in the selected div element, you pass a JavaScript object literal declaring all the information that the Telerik Report Viewer needs to a telerik_ReportView function tied to the div element.
With that loadReport function in place, I can call that function in my page’s jQuery ready event to load the report. Once the report is loaded, I capture a global reference to the report:
let rv;

$(() => {
    loadReport();
    rv = dashboardDiv.data("telerik_ReportViewer");
}
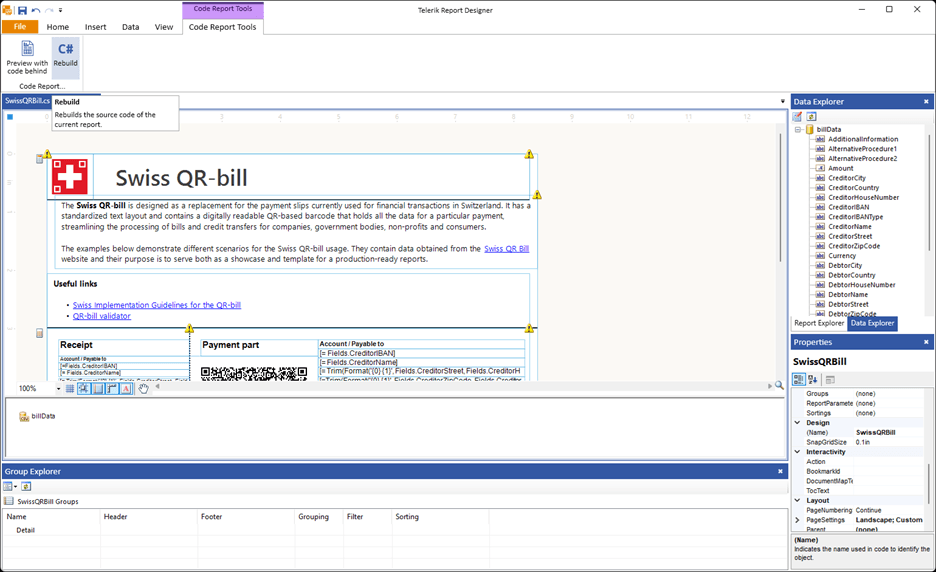
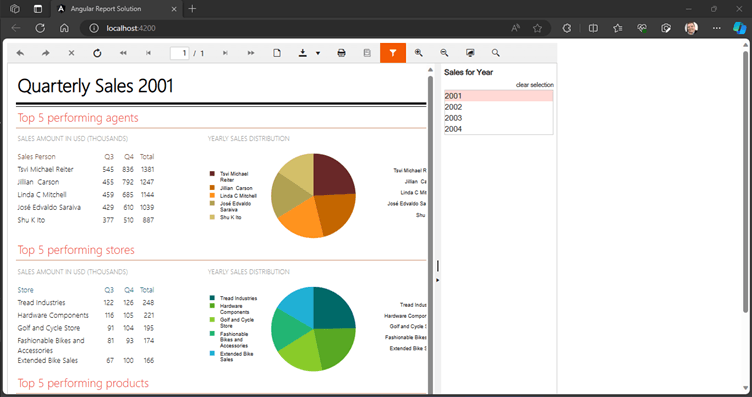
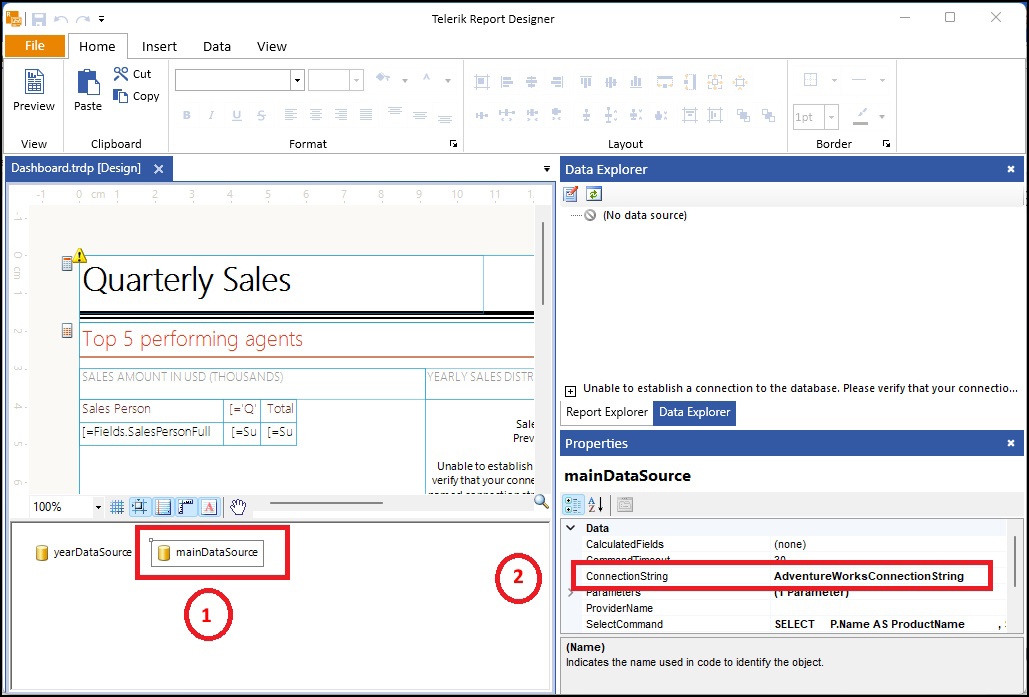
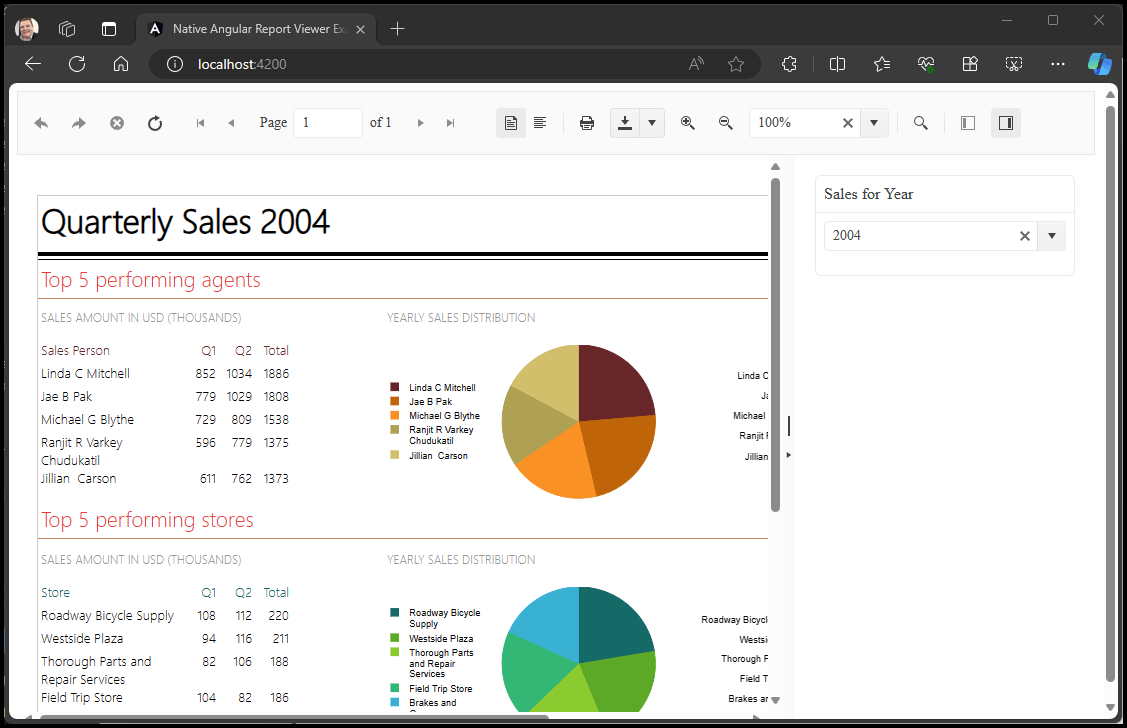
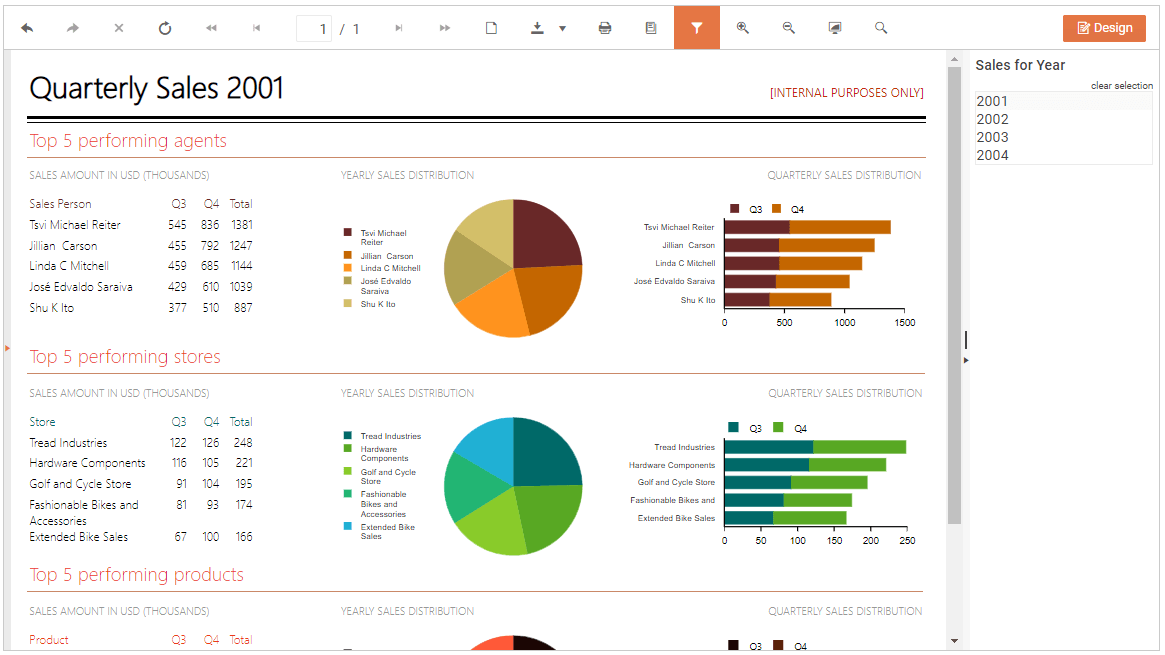
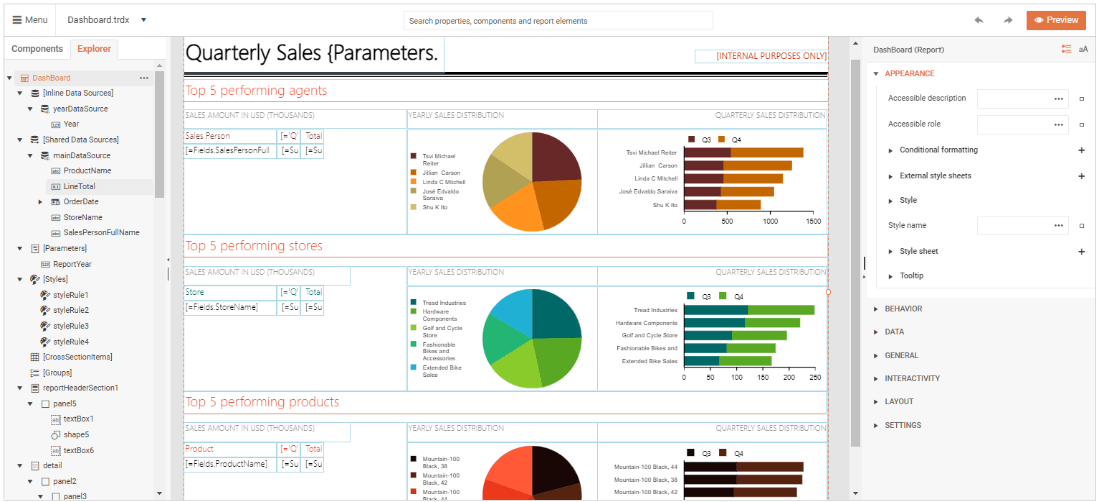
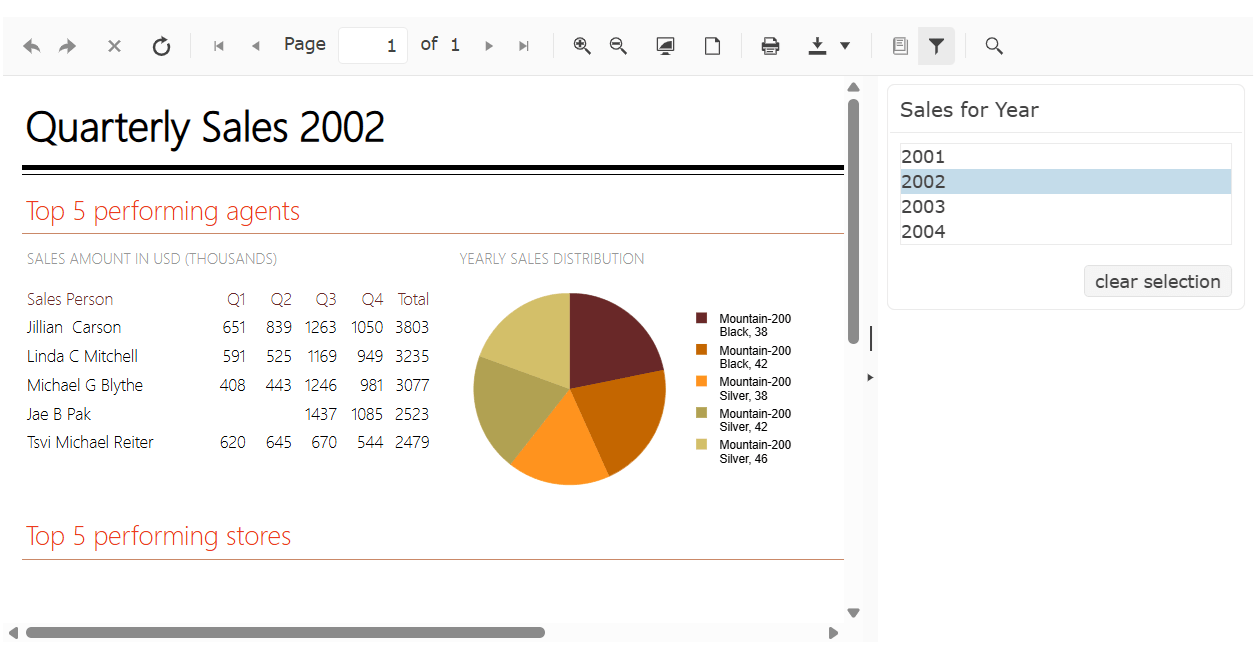
I’m using the Dashboard report as my case study because it provides an opportunity for adding interactivity: In the Dashboard report, a user can select a year from the list on the right side of the report and have that year displayed in the main body of the report on the left:
Capturing Report Events
To have your application’s host page react as the user interacts with the report that the page is displaying, you need to wire up a JavaScript function to a Report Viewer event. The Telerik Report Viewer provides more than a dozen events.
I’m going to use the updateUi event, which fires whenever the report’s UI changes (and picking a new year does change the report’s UI). To tie a function to an event, you declare the event in the JavaScript object literal that defines your report and then tie your function to that event.
Tying a function to the updateUi event looks like this:
reportSource: {
  report: "Samples/Dashboard"
},
updateUi: e => {

}
The updateUi event might not be the best choice for your application. If, for example, you wanted to be able to cancel the change (perhaps after validating the user’s input), you might prefer using the interactiveActionExecuting event which supports canceling user changes which updateUi event does not.
If you start wiring up more than one event in your report’s declaration (or if the function for an event gets large), then it can make your object literal hard to read. If so, you can define your function outside the object literal and just tie the function name to the event in your report’s object literal, like this:
const handleYearChange = e => {

    }
};

const loadReport = () => {
    dashboardDiv.telerik_ReportViewer(
     {
        reportServer: {
            url: "http://...",
            username: "…",
            password: "…"
        },
        reportSource: {
            report: "Samples/Dashboard"
        },
        updateUi: handleYearChange
     }
  );
};
If you want your event to be available some of the time, you can bind events dynamically by their names using the Report Viewer’s bind and unbind methods, passing the name of the event (slightly altered) and the function you want to bind to the event. This code binds and then immediately unbinds my handleYearChange function, for example:
rv.bind(telerikReportViewer.Events.UPDATE_UI, handleYearChange);
rv.unbind(telerikReportViewer.Events.UPDATE_UI, handleYearChange);
Writing Host Page Code
Now that I’ve tied the JavaScript function to the report’s event, I can access the report through the global reference I created after the report was loaded. Alternatively, inside the function, you can use the e parameter that’s passed to the function to access the report (it’s in the e parameter’s data.sender property):
const handleYearChange = e => {
    let rv = e.data.sender;
}
With that reference, I can now extend my handleYearChange function to update my host page and have my host page respond to the user’s changes to my report. For this case study, I’ll just display in a textbox in my host page the year that the user has selected in the report.
I’ll do the easy part first and add that textbox, setting its id attribute to currentYear and then create a JavaScript global reference to the textbox:
<input id="currentYear" />
const curInput = $("#currentYear");
The Report Viewer object model has, in addition to the events, a set of methods that return objects that you can use to manage the report. The Report Viewer ReportSource method, for example, returns an object with exactly one property, called parameters. That parameters property, in turn, exposes an object that has a named property for each parameter defined in the report (you’ll have to get the name of your parameter by opening the report in one of the Report Designers).
In my sample report, the parameter holding the currently selected year is called ReportYear and I can use that parameter to retrieve the year that the report is currently displaying.
One caveat: You want to exercise some care in the function that you tie to the updateUi event because the event is raised repeatedly as a page is loaded—once each for the page’s sections (header, body, footer, etc). Letting your code execute multiple times can lead to subtle bugs (we won’t ask how I know this).
Here’s the code in my updateUi event to grab the ReportYear parameter’s value and stuff it into my textbox (but do it only once, when the parameter changes):
let currentYear;

updateUi: (e) => {
    parms = rv.reportSource().parameters;
    if (currentYear !== parms.ReportYear) {
        currentYear = parms.ReportYear;
        curInput.val(parms.ReportYear);
    }
}
Now, whenever the user selects a year in the report, the textbox on the report’s host page will be updated.
Interacting with the Report
As I said at the start, interactivity goes two ways. When the user interacts with the report’s host page, you might want to have the report respond to that change. In my case study, I might want the report to display the data for a year that the user types into the textbox on my host page.
Implementing that requires setting the appropriate parameter on the report (ReportYear, in my case) from the user’s input (my CurrentYear textbox) and refreshing the report. To do that, I extend my textbox’s declaration to call a function when the user changes the contents of the textbox and exits the textbox:
<input id="currentYear" onchange="updateReport()" />
In this new updateReport function, I need to retrieve the current value from the textbox, update the appropriate parameter on the report (ReportYear, in my case), and call the report’s refreshReport method—still using the global reference to the report that I created after the report was loaded. That code looks like this:
let UpdateReport = () => {
    let parms = rv.reportSource().parameters;
    parms.ReportYear = curInput.val();
    rv.refreshReport();
};
Now, as the user interacts with my host page, my report will respond.
Obviously, these are very simple examples, but the Report Viewer has more methods than the ReportSource method that I’ve used. But what you have here is the basic structure of any kind of integration you’ll want to add, regardless of what you want to do.
Telerik Reporting comes with your favorite framework UI component library when you bundle with Progress Telerik DevCraft. And this all comes with a 30-day free trial. So, go on: