Rate limiting helps force clients to consume resources responsibly. Here’s how to use this technique to secure our web server and its resources from abuse.Rate limiting is a technique that verifies clients consume the server’s resources responsibly. It is essential for preventing malicious actors from abusing resources. This technique monitors each client’s requests to API endpoints. If their requests exceed a particular limit—that is, breach a particular constraint within a time frame—the client is either blocked or their request is delayed, slowed down or silently ignored.
NestJS is a popular framework that makes it easy for developers to build enterprise-grade server-side applications and provides them with a suite of tools to solve common problems.
In this article, we will be exploring the package for rate limiting. We will first explore rate limiting and some of its core concepts and see how this tool can be used to solve common rate limiting problems in our NestJS applications. We will explore some interesting challenges when implementing rate limiting in real-world applications and examine configurations that this package provides to help us counter those problems.
Prerequisites
This guide assumes the reader is familiar with TypeScript, backend development using Node.js, and HTTP and RESTful APIs.
Project Setup
Assuming you have the Nest CLI installed, let’s now set up a NestJS project by running the following command:
nest new rate-limiting
The application is created in a folder called rate-limiting. Feel free to pick a folder name of your choice.
Next, let’s install @nestjs/throttler, which is the rate limiting package for NestJS.
cd rate-limiting
npm install @nestjs/throttler
How Rate Limiting Works
Now, let’s briefly describe how rate limiting works and highlight some of the core concepts powering it. Understanding this section will be important when we start using the @nestjs/throttler package.
- The resource owner defines the constraint on what is allowed—that is, the limit. Limits are time-bound. The time frame a limit is applied to is called a window, and limits are expressed as “limit per window” (e.g., five requests per second, one job per hour, etc.).
- The resource owner then tracks the client’s requests to access their resources. Tracking can be done based on some identifier (e.g., an ID of some database entity, the client’s IP address, etc.). Tracking is a stateful operation, so the resource owner implements some storage mechanism to hold tracking information for clients. The storage containers to hold this information could be databases or in-memory storage.
- If the client exceeds the defined limit, the resource owner responds either by blocking the request for some duration and returning a 429 response code or by throttling the request (i.e., ignoring or slowing down the response to the user’s request).
- The resource owner implements a rate limiting algorithm to make everything work. Common rate limiting algorithms include token bucket, leaky bucket, fixed window and sliding window algorithms.
Examples of rate limiting in real-world applications include the following:
- A payment gateway may limit requests from clients trying to get the status of a transaction to, for example, one request per minute.
- A cloud service like EAS limits users with free tier accounts to only create 30 builds for their mobile applications per month, with a concurrency limit of one.
- A media manipulation service like Cloudinary constrains API consumers on a free account to upload a limited number of files in each request, with each file not exceeding a particular size.
The @nestjs/throttler Module
Let’s now explore the contents of the rate limiting module we will be using:
- It provides an abstraction over all the complexity involved in rate limiting and provides us with a simple interface to set up only the rate limiting options we need, while it handles the rest.
- It provides a wide range of options that allow us to configure limits, handle client tracking, storage, etc.
- It is storage agnostic, so it allows us to optionally configure different storage mechanisms for tracking. By default, tracking is done using an in-memory store using the JS Map data structure. It also supports regular databases—the most popular option here is Redis, as we will see later.
- If the client exceeds the defined limit, this module responds by blocking the client.
- Although this guide will explore how it can be used in a RESTful API, it is also compatible with GraphQL and WebSockets.
Setting up Some Routes
Normally, a web server will contain one or more endpoints. Let us define a few. Update your app.controller.ts file with the following:
import { Controller, Get } from "@nestjs/common";
@Controller("app")
export class AppController {
  @Get("/a")
  getA(): string {
    return "this is A";
  }
  @Get("/b")
  getB(): string {
    return "this is B";
  }
  @Get("/b")
  getC(): string {
    return "this is C";
  }
}
We defined three routes: /app/a, /app/b and /app/c. Verify that AppController is mounted in the app.module.ts file as shown below:
import { Module } from "@nestjs/common";
import { AppController } from "./app.controller";
@Module({
  imports: [],
  controllers: [AppController],
  providers: [],
})
export class AppModule {}
Add Rate Limiting to the Entire App
Update the app.module.ts file to look like this:
import { Module } from "@nestjs/common";
import { AppService } from "./app.service";
import {
minutes,
seconds,
ThrottlerGuard,
ThrottlerModule,
} from "@nestjs/throttler";
import { APP_GUARD } from "@nestjs/core";
import { AppController } from "./app.controller";
@Module({
imports: [
ThrottlerModule.forRoot({
throttlers: [
{
name: "first",
ttl: 1000,
limit: 1,
blockDuration: 1000,
},
{
name: "second",
ttl: seconds(10),
limit: 5,
blockDuration: seconds(5),
},
{
name: "third",
ttl: minutes(1),
limit: 25,
},
],
errorMessage: "too many requests!",
}),
],
controllers: [AppController],
providers: [
AppService,
{
provide: APP_GUARD,
useClass: ThrottlerGuard,
},
],
})
export class AppModule {}
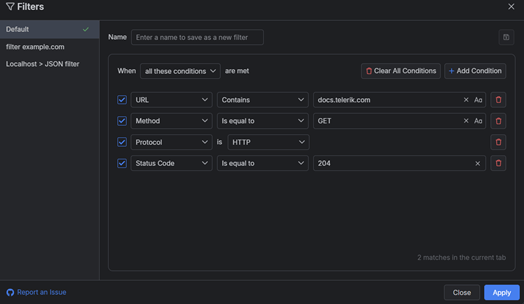
The ThrottleModule enables us to define the rate limiting options in our app. Using either its forRoot() or forRootAsync() overloaded methods, we pass an object defining the options we want. The most important property is one called throttlers—it holds an array of objects, each representing the rate limiting options we want. We can declare as many as required. In our case, we specified three of them.
Each throttle option has properties, but the only mandatory ones are limit and ttl (time to live). However, we added some other interesting ones, which we will look at in a bit.
We can read the first entry in the options array like so: The client is limited to 1 (limit) request per 1000ms (TTL), and if they exceed that, they will be blocked for 1000ms (blockDuration) during which the server responds with a 429. You can apply this model to read the remaining options.
While there are many other optional options (six others at the point of writing), we only used two: blockDuration and name. The former is quite intuitive; if not specified, it defaults to the TTL value. Note that time is always specified in milliseconds when using this module.
The name property defines a name for the group. If not specified, it resolves to the string default. This property helps during tracking to distinguish how tracking information will be stored across options.
We can also add options to define how we want to generate identifiers to track clients or whether, for some option groups, we may want to skip some routes in our app.
Now, for the root object, we also included another optional property called errorMessage, which accepts a string or a function that resolves to the message that will be sent when the user exceeds any of the defined limits.
Finally, we need to verify our entire application is guarded using the rate limiting options, so we used the special APP_GUARD injection token to provision the ThrottlerGuard class. The ThrottlerGuard class is where all the magic happens. It is responsible for tracking and maintaining the state for clients and blocking them when necessary.
To test our running application, open the terminal and start the server by running the following command:
npm run start:dev
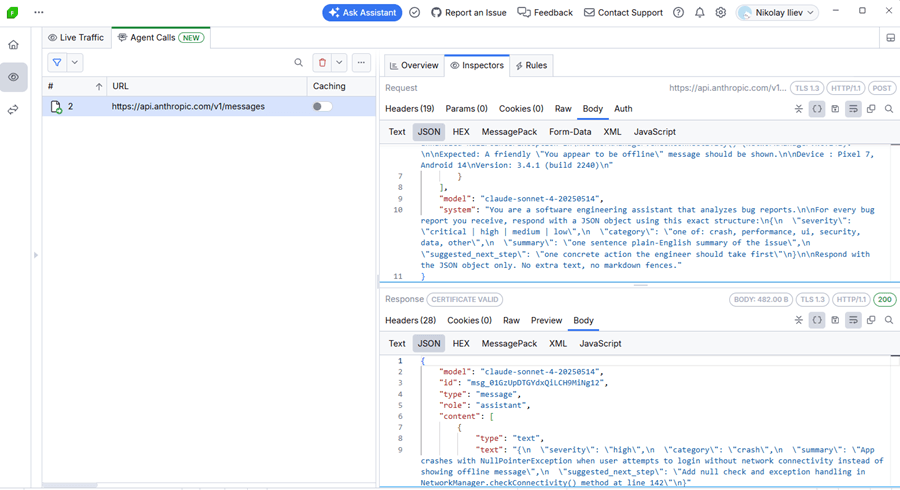
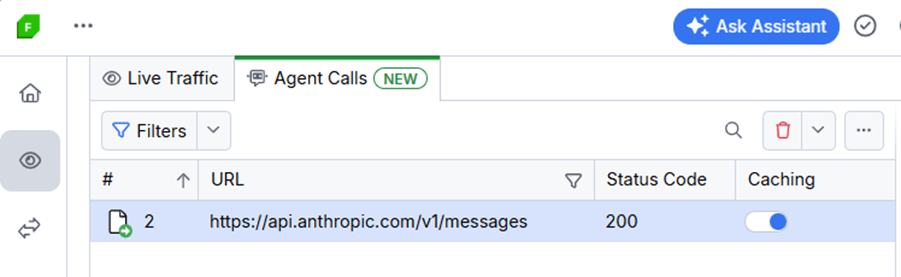
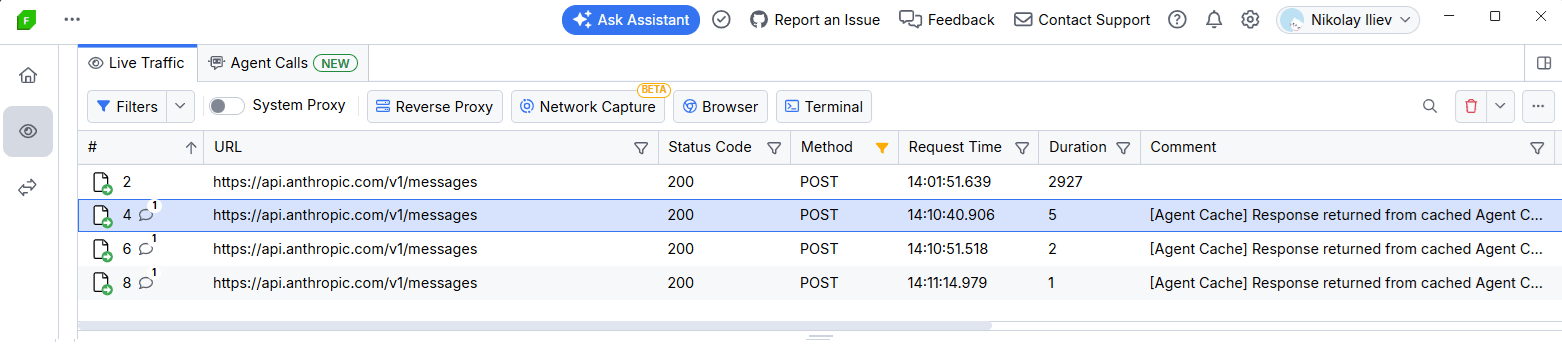
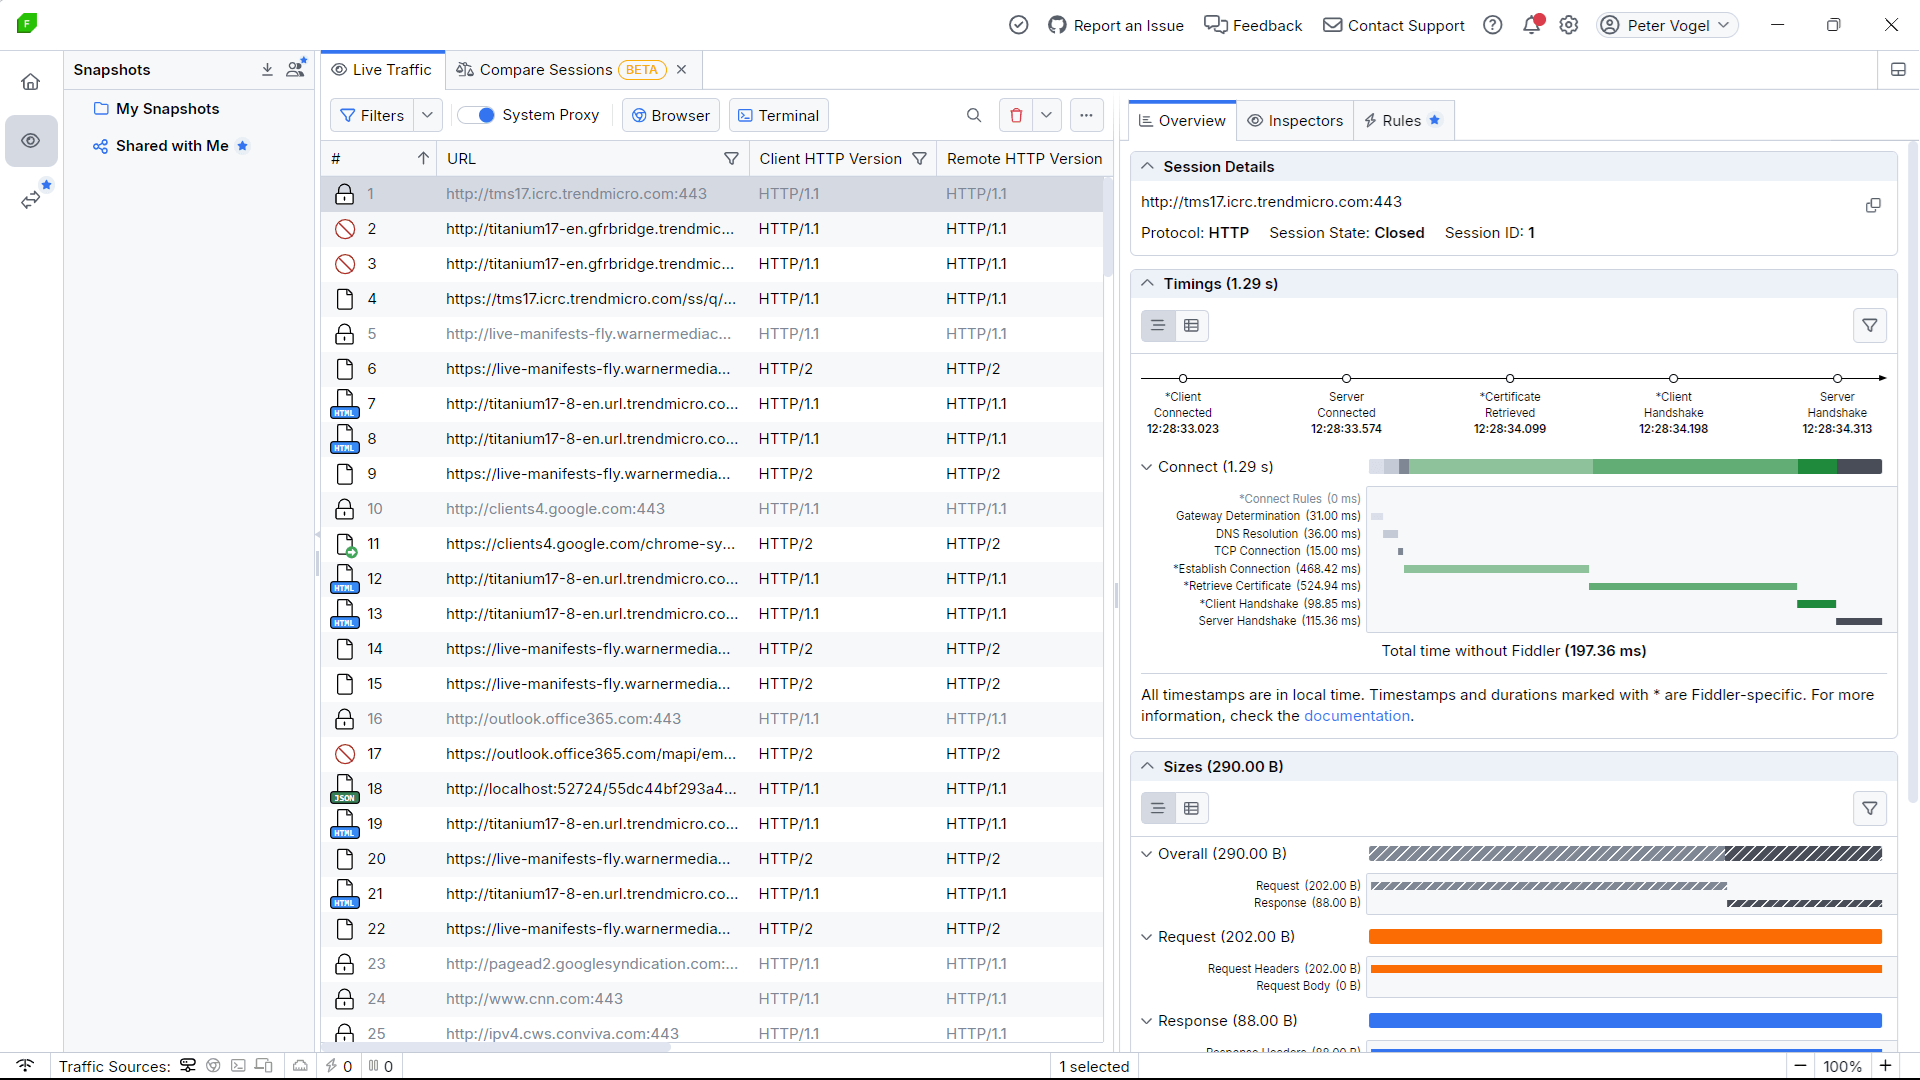
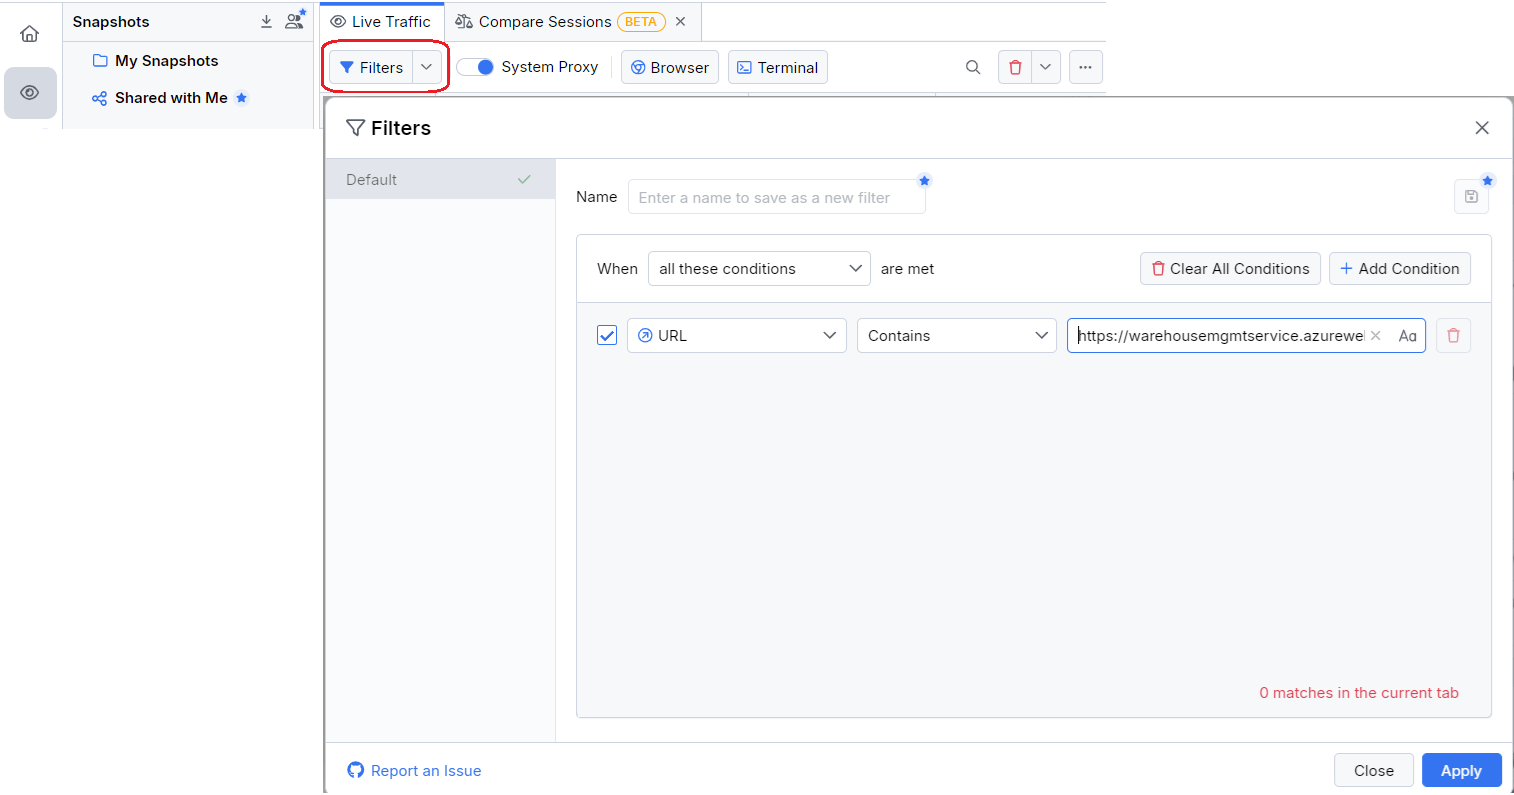
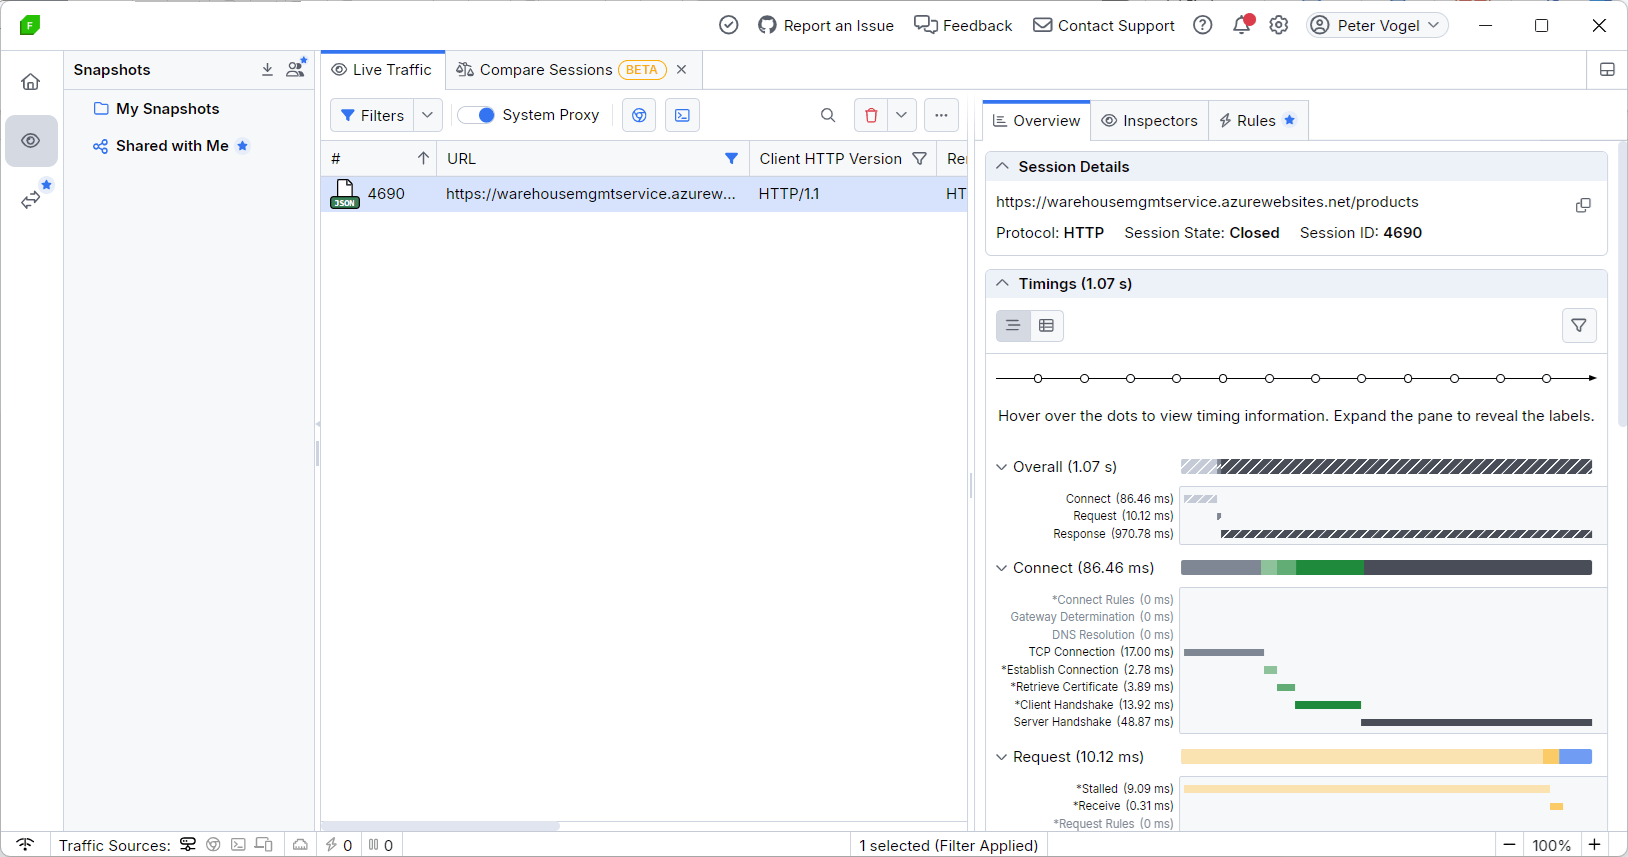
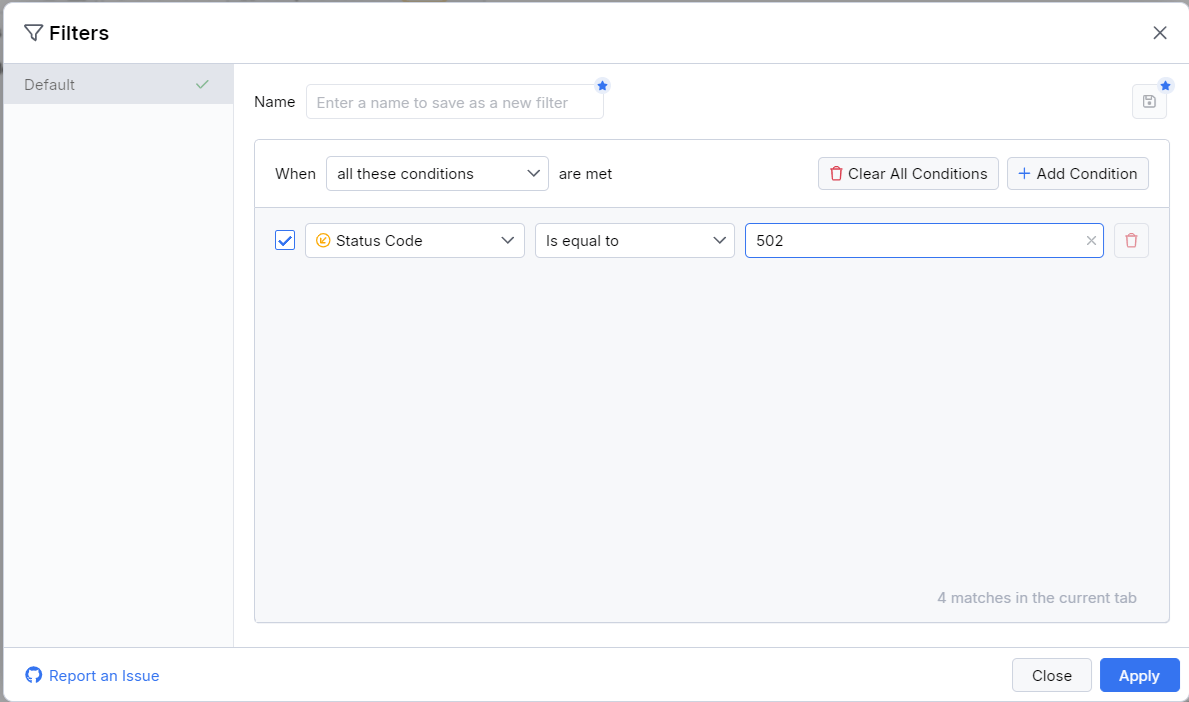
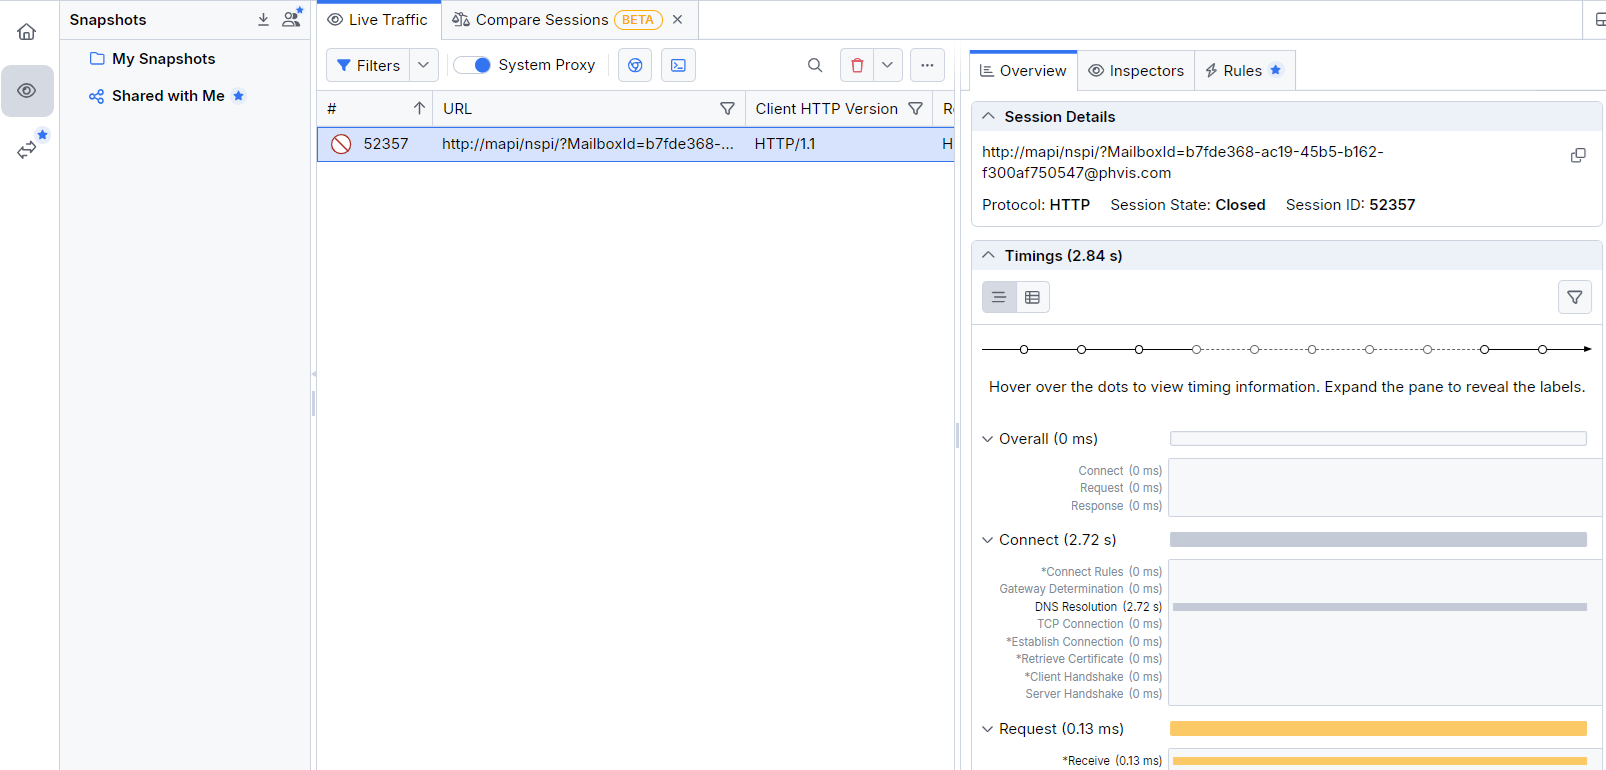
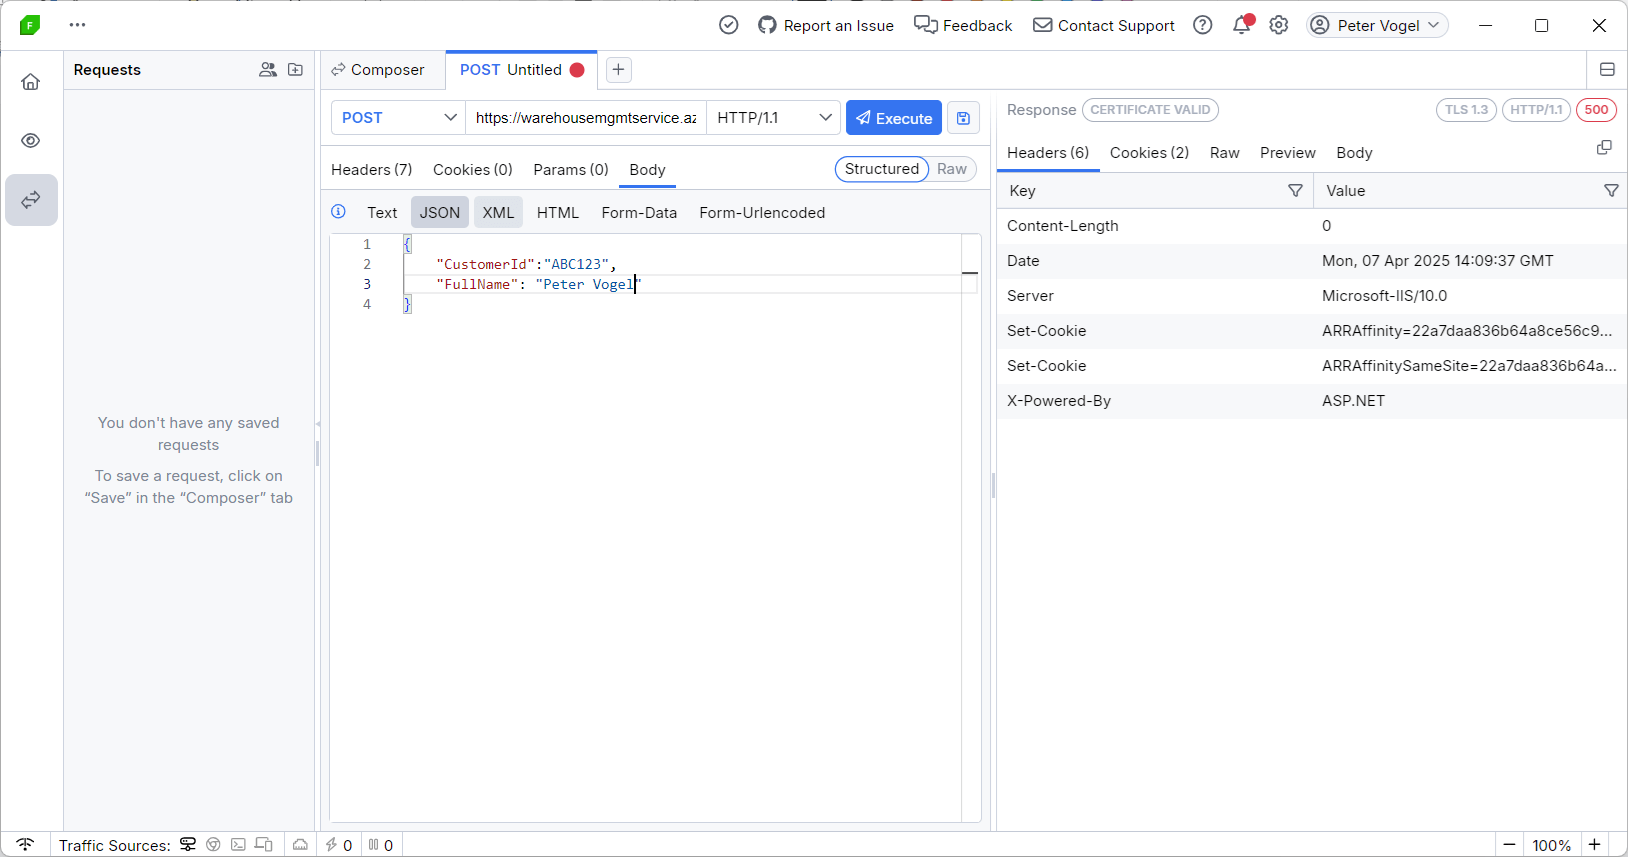
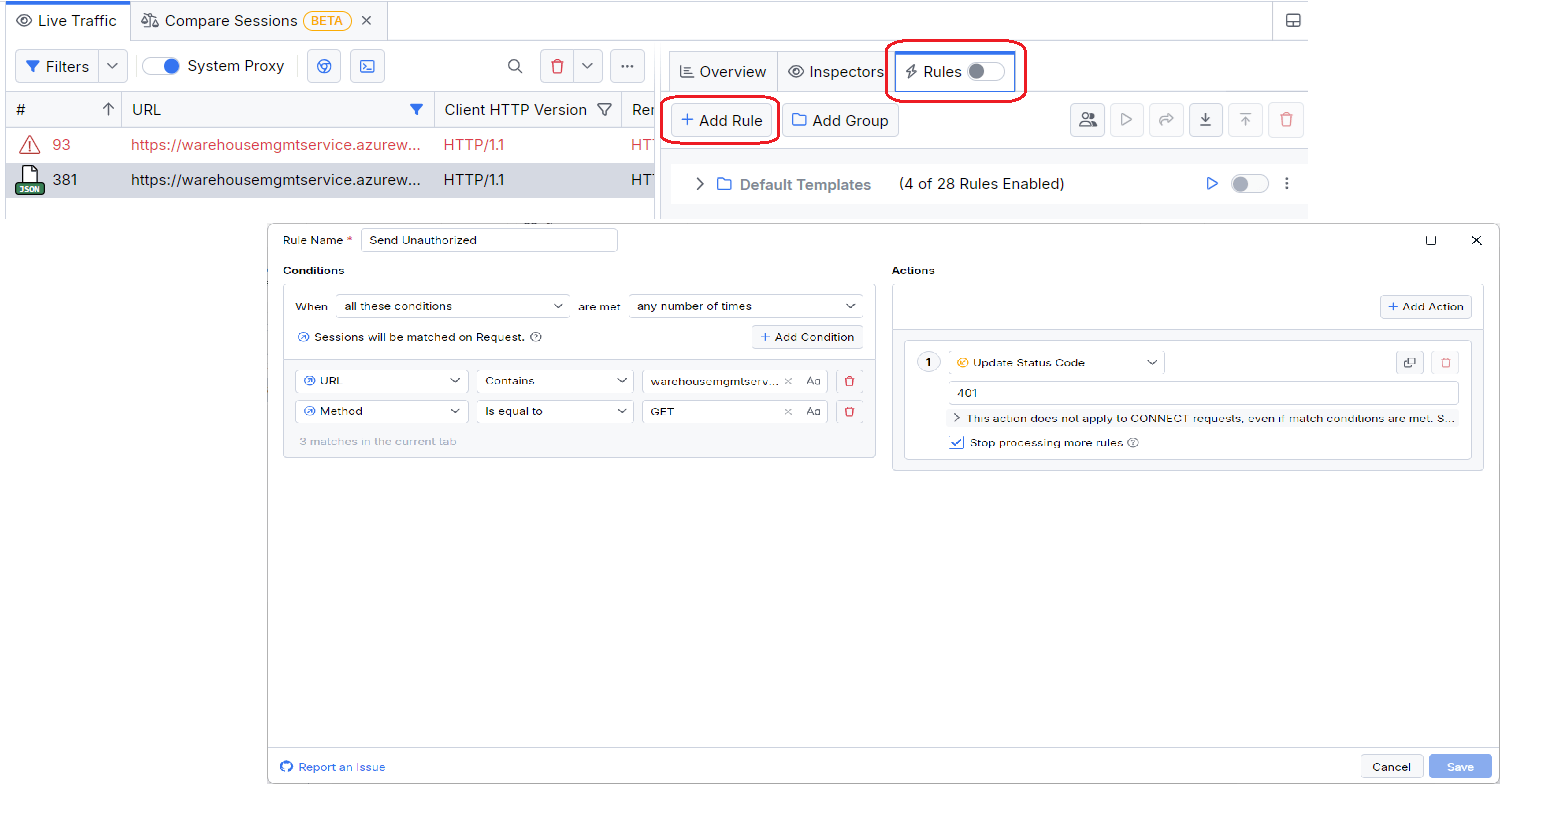
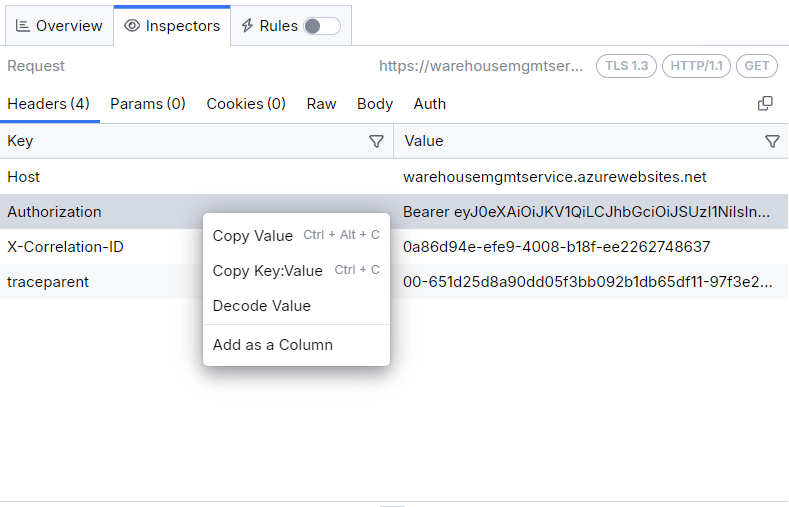
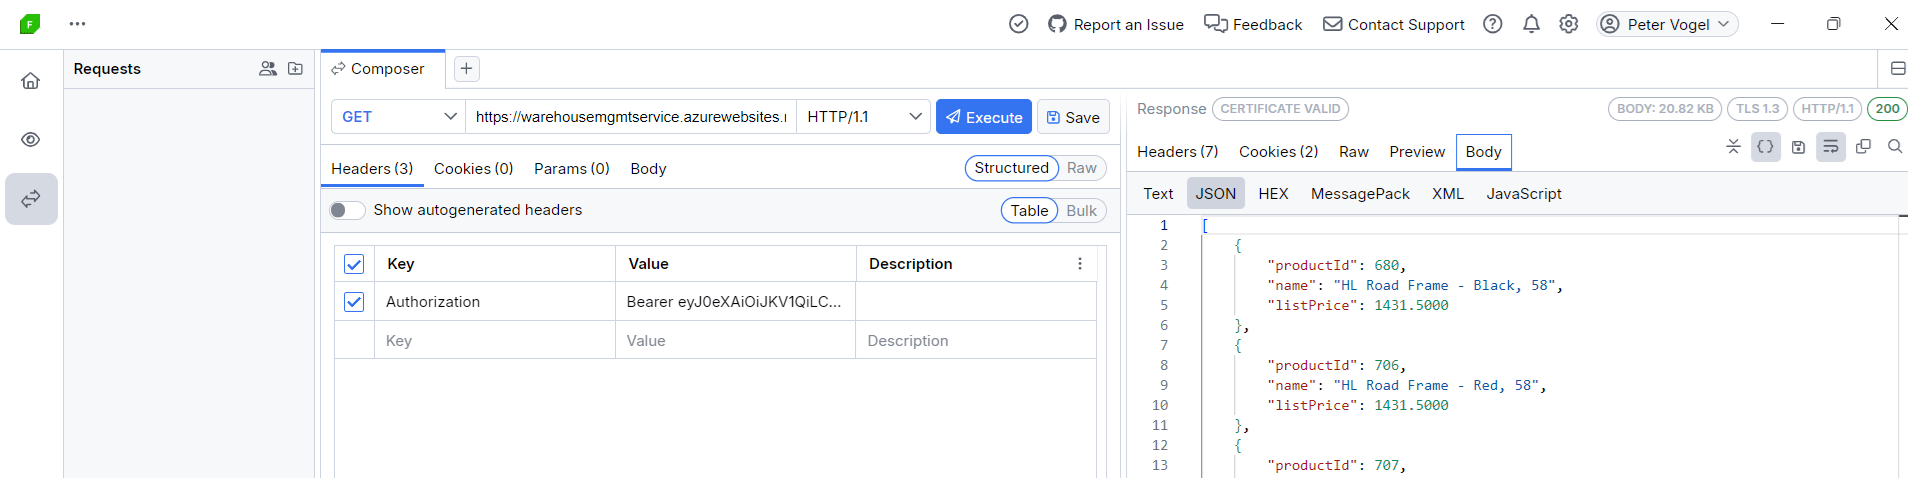
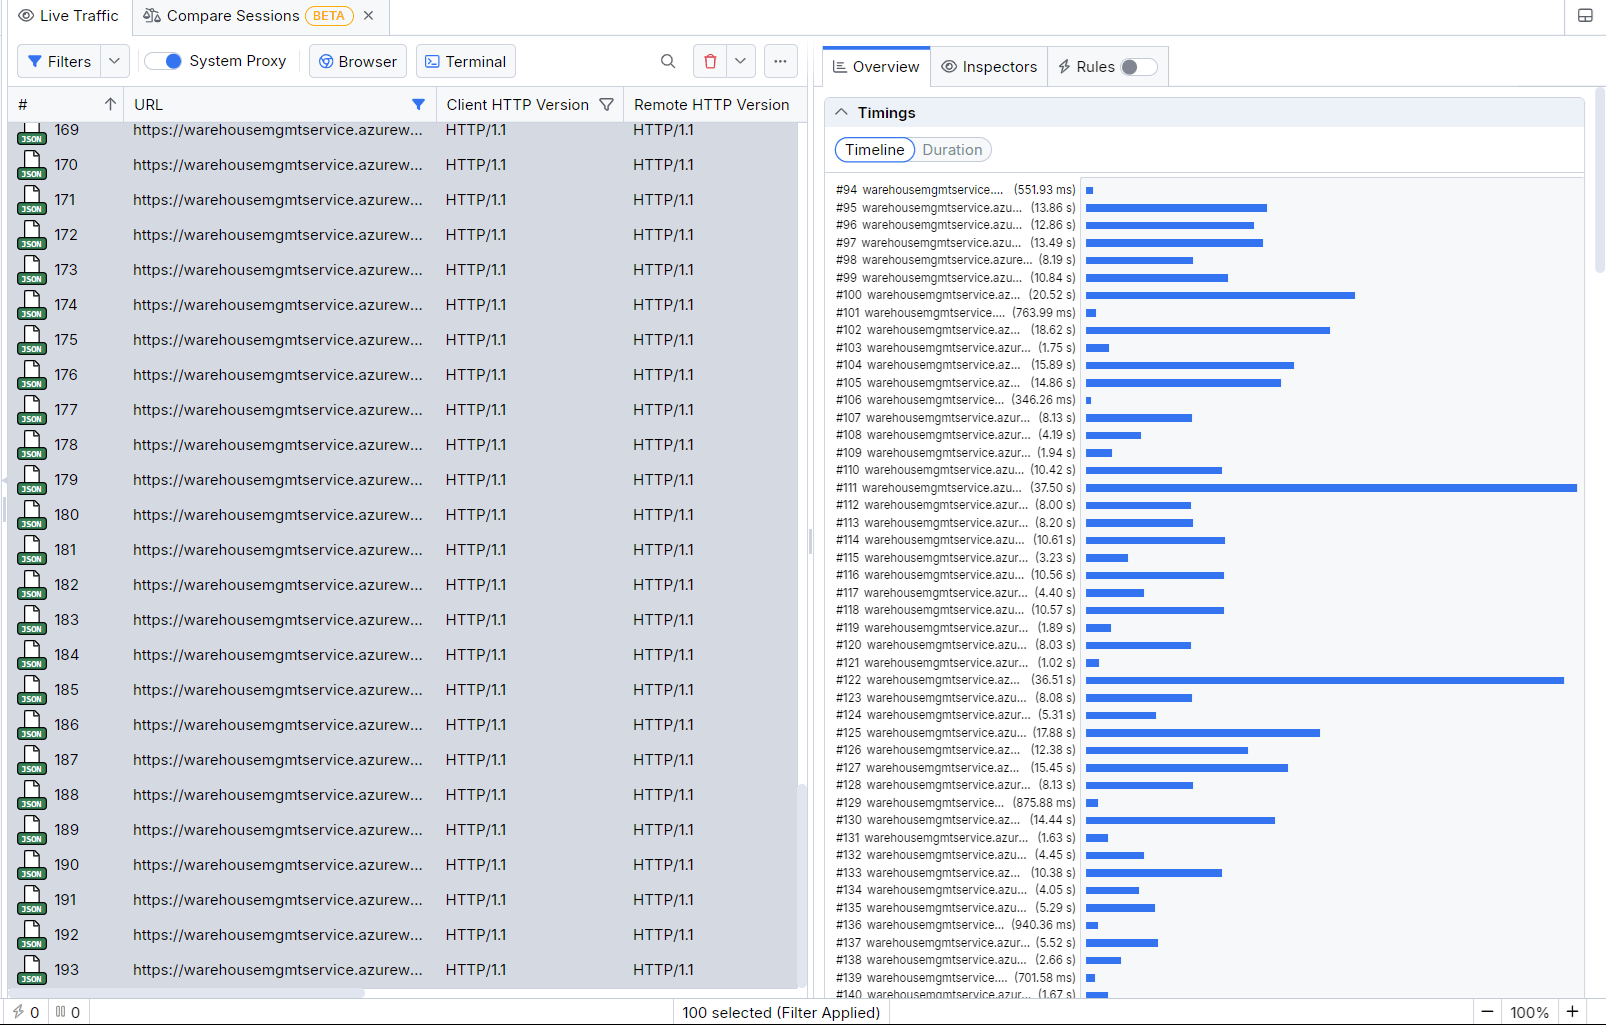
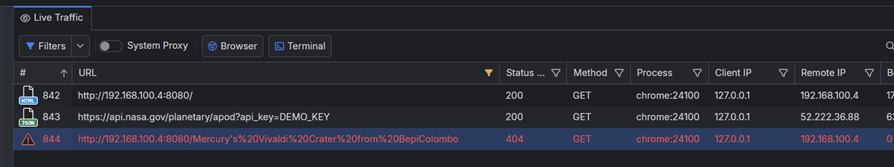
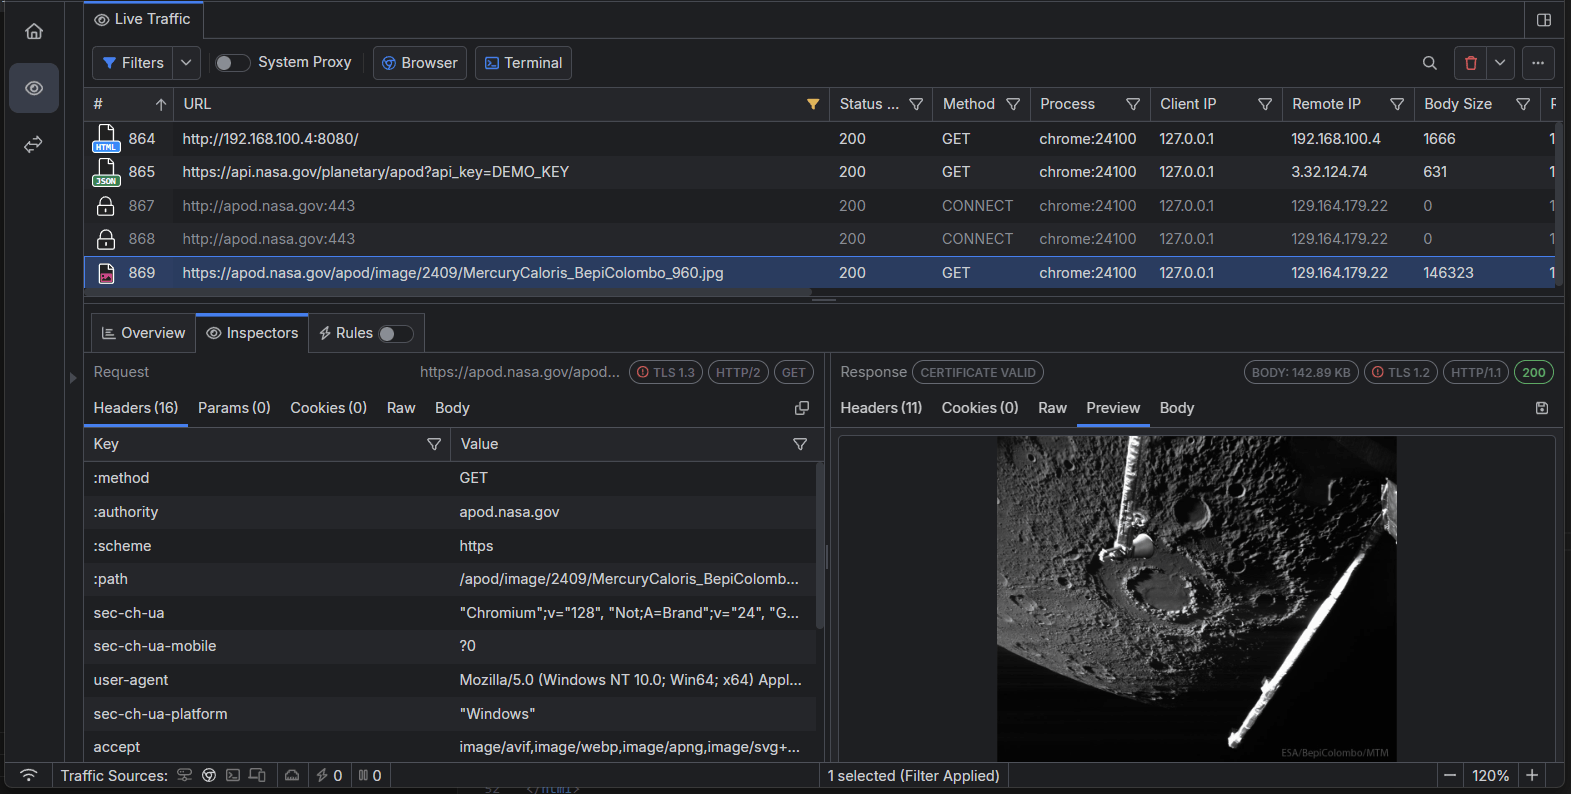
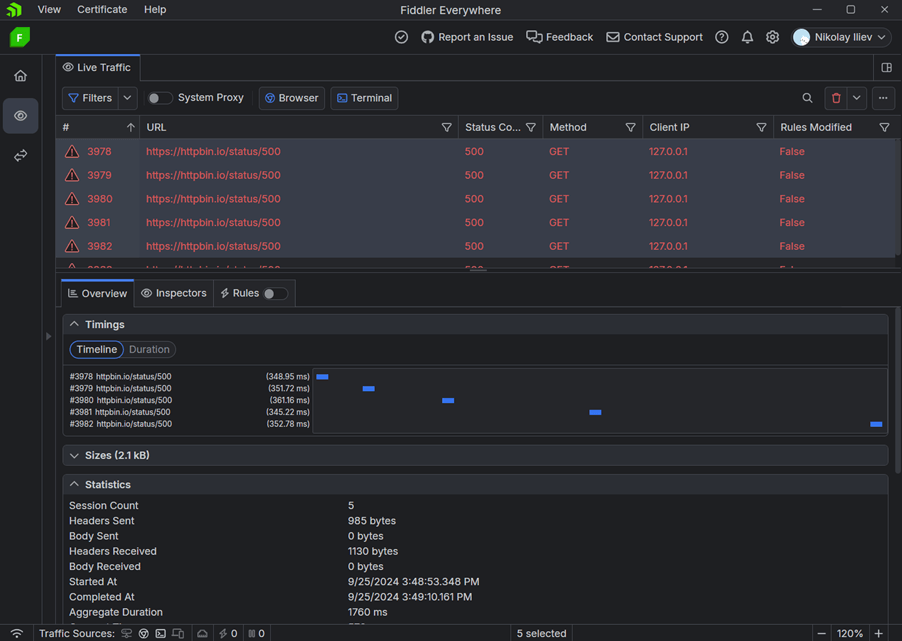
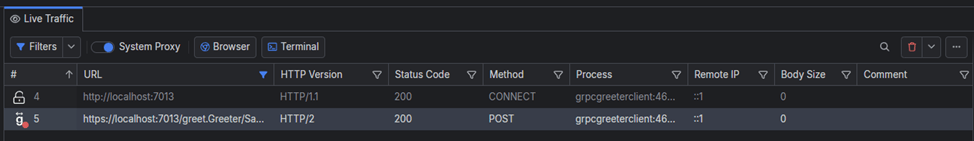
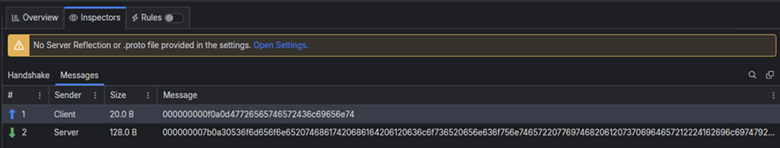
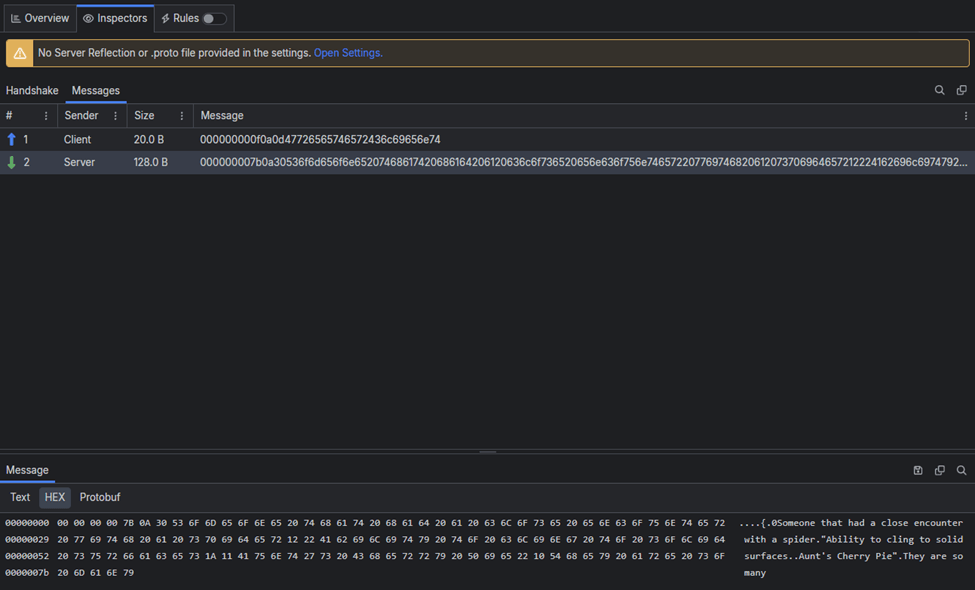
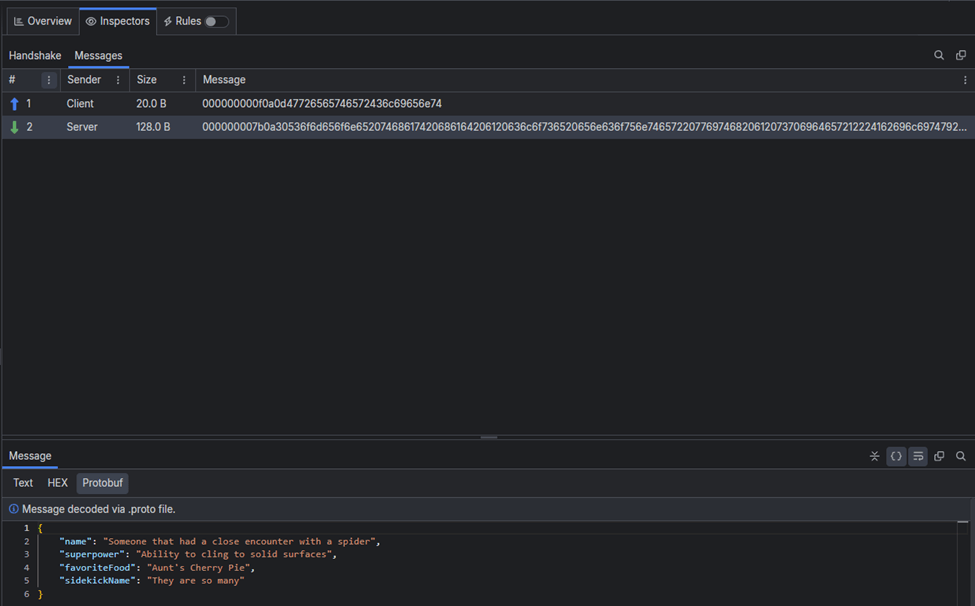
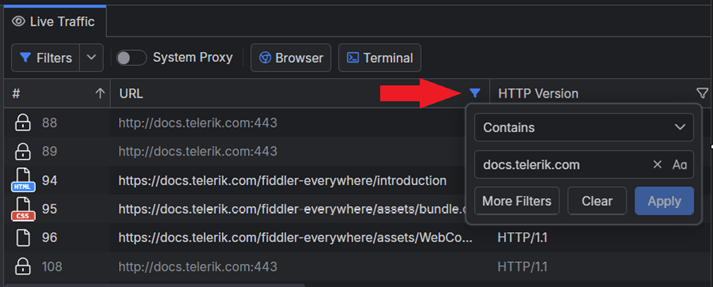
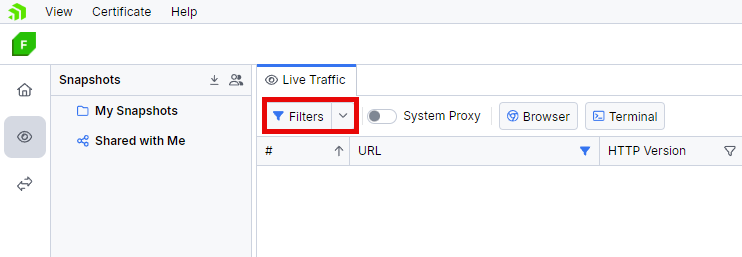
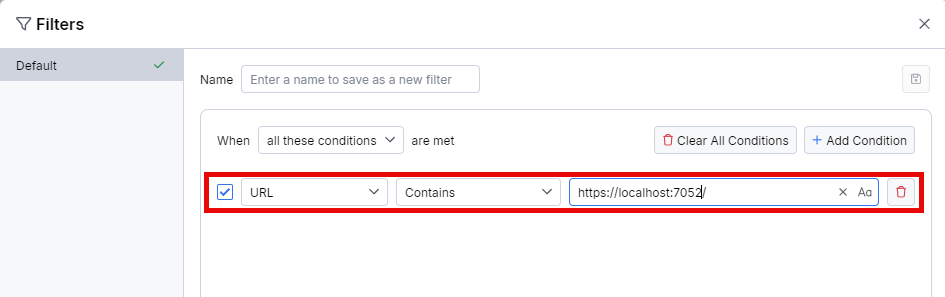
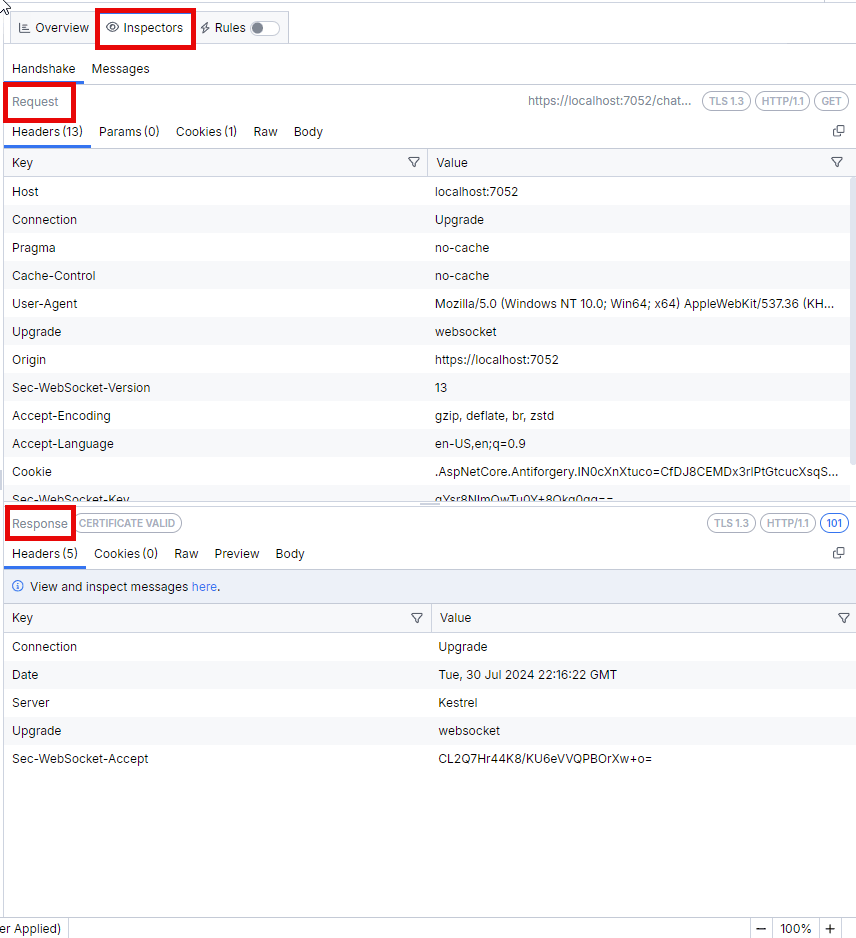
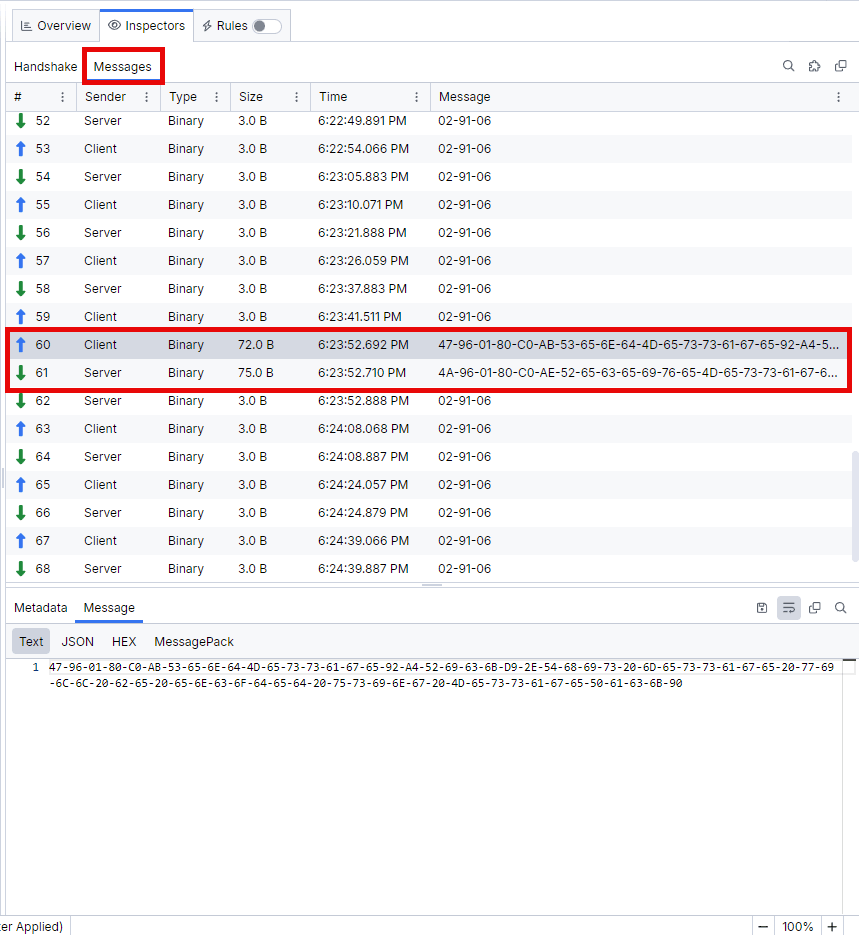
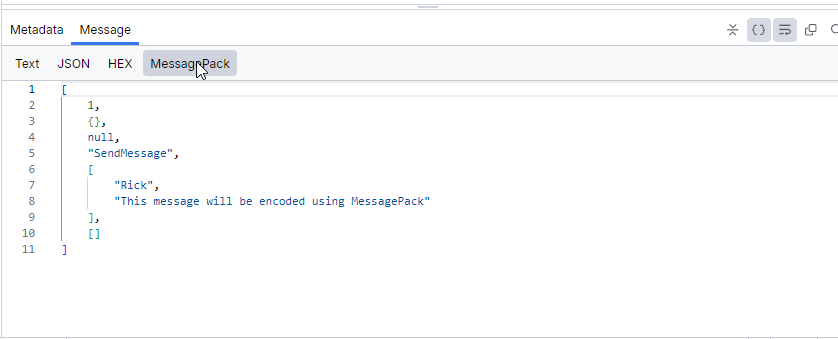
Using a browser’s address bar or any API testing platform, let’s proceed to test our API. In this article, we will be using Progress Telerik Fiddler Everywhere. Notice that whenever we exceed any of the limits, we get a 429 response as shown below.

How Tracking Works

Tracking information is stored in a map using key-value pairs. A hyphen (-) separates the pieces that make up the tracking keys. The tracking key is derived from the name of the controller, the handling function, the name of the throttle option and a custom client identifier. By default, this is the client’s IP address.
The diagram above shows the key in plain text, but internally they are hashed (SHA256) before they are used as keys.
The tracking data is derived from the throttle options. It maintains relevant information such as:
- How many requests the client made
- The time for each limit
- The block duration and status
Notice that there are three instances of the tracking keys and their corresponding tracking information maintained for each endpoint for each client, since we defined three different options.
Overriding Rate Limiting Options for Certain Routes
Update your app.controller.ts file to match the following:
import { Controller, Get } from "@nestjs/common";
import { Throttle } from "@nestjs/throttler";
@Controller("app")
export class AppController {
  @Throttle({
    first: {
      ttl: 3000,
      limit: 1,
      blockDuration: 10000,
    },
  })
  @Get("/a")
  getA(): string {
    return "this is A";
  }
  @Get("/b")
  getB(): string {
    return "this is B";
  }
  @Get("/b")
  getC(): string {
    return "this is C";
  }
}
Depending on what your application needs, it is often better to change the rate-limiting options either on one endpoint (i.e., at the route level) or a group of endpoints (i.e., at the controller level). Regardless of which, the @nestjs/throttler module provides us with the handy Throttle decorator to do so.
This function expects an object whose keys are the throttle option name attributes configured earlier in the forRoot method of the ThrottlerModule. The values are just overrides of the previous options.
In our case, we reconfigured the option called first and we limited it to one request every three seconds, with a block duration of 10 seconds.
Now if we try to hit /app/a more than once in three seconds, we get an error. Also note that second and third settings will still apply to this endpoint.
Partly or Completely Disabling Rate Limiting for One or More Routes
Not all parts of an application will need rate limiting. Update your app.controller.ts file with the following:
import { Controller, Get } from "@nestjs/common";
import { SkipThrottle, Throttle } from "@nestjs/throttler";
@Controller("app")
export class AppController {
@SkipThrottle({
first: true,
second: true,
})
@Get("/b")
getB(): string {
return "this is B";
}
}
The SkipThrottle decorator allows us to disable rate limiting again, either on the controller or route level. It expects an object whose keys are the names of throttle options and whose values are booleans. For example, in our case we disabled first and second throttle options on the /app/b endpoint. This means only the rate limiting option named third will apply to this route.
Rate Limiting Problems in Real World Applications
In this section, we will look at some common rate limiting problems we encounter in real-world applications and how we can solve them. Our solutions will use the @nestjs/throttler module and some of the features provided by the Nest framework:
- Tracking clients by IP address when our web server is behind a reverse proxy
- Storing client tracking information across multiple instances
Tracking Clients by IP Address When Our Web Server Is Behind a Reverse Proxy
It has already been established that the @nestjs/throttler module allows us to track users based on different identifiers, but by default it does so using the client’s IP, which is the most common option.
There are some interesting things to note here: When we deploy our server-side applications, in most cases, we don’t allow direct client communication with them. Rather, we usually place our server behind another web server (e.g., Nginx, Apache, Caddy, Traefik, etc.) which serves as a load balancer and/or reverse proxy. Load balancers provide many benefits when paired with our web server, such as security from attackers, caching, compression, traffic distribution, etc.

Each time the client makes a request, it goes through the reverse proxy and then to our actual NestJS server. To verify our NestJS server knows about the client’s IP where the request originated from, we need to check that the load balancer sends this information to it. When using a load balancer like Nginx, by default this information is not sent. This means our NestJS server treats the request as if it originated from Nginx, and this is not what we want.
For our demo let’s create a docker-compose.yaml file in the project’s root and add the following to it:
services:
backend1:
build:
context: .
dockerfile: Dockerfile
target: development
expose:
- 3000
volumes:
- ./src:/app/src
- /app/node_modules
command: npm run start:dev
hostname: backend1
container_name: backend1
nginx:
image: nginx
depends_on:
- backend1
ports:
- "8080:80"
volumes:
- ./nginx.conf:/etc/nginx/nginx.conf
We set up two services: the first being our NestJS web server called backend1, which has a hostname of backend1 and exposes port 3000 to other containers. The other is Nginx, the load balancer we will be using, that is exposed on our machine on localhost:8080. We created an nginx.conf file in our project root. We defined a bind mount to override the contents of the one that ships with the Nginx container.
This file looks like so:
worker_processes 1;

events {
    worker_connections 1024;
}
http {
    include mime.types;
    upstream backend_cluster {
        # round robin algorithm is used by default
        server backend1:3000;
    }
    server {
        listen 80;
        server_name localhost;
        location / {
            # Proxy requests to the upstream we called backend_cluster
            proxy_pass http://backend_cluster;
            # Pass the X-Forwarded-For header
            proxy_set_header X-Forwarded-For $proxy_add_x_forwarded_for;
            proxy_set_header X-Client-Ip $remote_addr;

            proxy_set_header Host $host;
        }
    }
}
We will focus on the more important blocks in this file:
The proxy_pass directive proxies requests from the load balancer to our backend cluster named backend_cluster in the upstream block. The upstream block for now has one entry that points to our NestJS server (i.e., “backend1:3000”).
To forward the client IP address, we used two custom headers to show two different ways we can do this. The first is a random header we called X-Client-IP and the other is the more popular X-Forwarded-For header, which we are more interested in. Both of them will set the client’s IP, which is stored in the $remote_addr variable. $proxy_add_x_forwarded_for uses this internally and appends the client’s IP to whatever was set in the X-Forwarded-For that came with the original request.
The Host header verifies that the upstream (i.e., our NestJS server) receives the right URL so that the right controller attends to the request.
If you prefer using the custom header, we can just directly extend the ThrottlerGuard and override its getTracker() method as shown below.
Let’s update our app.module.ts file with the following:
@Injectable()
export class ThrottlerBehindProxyGuard extends ThrottlerGuard {
protected async getTracker(req: Record<string, any>): Promise<string> {
return req.headers["x-client-ip"];
}
}
@Module({
imports: [
ThrottlerModule.forRoot({
throttlers: [
],
errorMessage: "too many requests!",
}),
],
controllers: [AppController],
providers: [
AppService,
{
provide: APP_GUARD,
useClass: ThrottlerBehindProxyGuard,
},
],
})
export class AppModule {}
In the code above, we retrieved the client’s IP from the custom header set.
We can directly read the contents of the X-Forwarded-For header from the request object, like we did previously with our random X-Client-IP header. However, this header is a somewhat de facto header used by most proxy servers (e.g., Nginx in our case) to forward the client’s IP to the web server behind it.
This header is already known to ExpressJS, so we just need to do a few things to enable the Express APIs to parse it for us automatically.
Let’s now tweak our backend code to parse this value. Update your main.ts file with the following:
import { NestFactory } from "@nestjs/core";
import { AppModule } from "./app.module";
import { NestExpressApplication } from "@nestjs/platform-express";
import { Injectable, ExecutionContext, CallHandler } from "@nestjs/common";

async function bootstrap() {
  const app = await NestFactory.create<NestExpressApplication>(AppModule);
  app.set("trust proxy", true);
  await app.listen(3000);
}
bootstrap();
NestJS allows us to choose between Express or Fastify, and we are going to use the former.
By setting the trust proxy setting on the Express API, it automatically tells Express to trust the X-Forwarded-For header and parse it to an array, storing it in the request object in its ips array (i.e., req.ips).
It then picks the leftmost entry in this array and stores it in req.ip. To put it in more context: assuming the X-Forwarded-For holds “a b c” (assuming there were two hops before the request reached our web server, where a, b and c are IP addresses), req.ips will hold [a, b, c] and req.ip holds a, where a is the client’s IP address.
By default, since the @nestjs/throttler module relies on the req.ip property for tracking, everything works automatically just by using the trust proxy setting without having to extend the ThrottlerGuard class like we did to manually extract the contents of our X-Client-IP header for @nestjs/throttler.

Another great thing about having our web server behind a load balancer is that it allows us to run multiple instances of the web server while the load balancer distributes incoming traffic across all instances. This is important for throughput, availability and proper resource utilization.
In the context of rate limiting, this also presents some storage concerns. First, by default, since the @nestjs/throttler module uses an in-memory store (a JavaScript Map data structure, to be specific), to remember tracking information for rate limiting, this means when we have multiple instances of our app, each instance maintains its own in-memory store, as shown below.

This storage decentralization presents a problem (i.e., assuming we have three instances, a, b and c, it is possible for a client to be blocked on one of the servers, e.g., a, and still be able to access b and c).
So we need to centralize the storage location for the tracking information and move to a structure that looks like the one below.

The @nestjs/throttler module allows us to provide our storage option if we want, provided it implements the ThrottlerStorage interface. We won’t be creating ours; instead, we will use a community-provided package that allows us to use Redis as the persistence layer.
Let’s install this module in our app. Run the following command in your terminal:
npm install --save @nest-lab/throttler-storage-redis ioredis
Next, let us update our docker-compose.yaml file to set up Redis, and then make three instances of our web server in our file:
services:
backend1:
build:
context: .
dockerfile: Dockerfile
target: development
ports:
- "3002:3000"
expose:
- 3000
environment:
INSTANCE_NAME: BACKEND_1
volumes:
- ./src:/app/src
- /app/node_modules
command: npm run start:dev
hostname: backend1
container_name: backend1
backend2:
build:
context: .
dockerfile: Dockerfile
target: development
ports:
- "3003:3000"
expose:
- 3000
environment:
INSTANCE_NAME: BACKEND_2
volumes:
- ./src:/app/src
- /app/node_modules
command: npm run start:dev
hostname: backend2
container_name: backend2
backend3:
build:
context: .
dockerfile: Dockerfile
target: development
ports:
- "3004:3004"
expose:
- 3000
environment:
INSTANCE_NAME: BACKEND_3
volumes:
- ./src:/app/src
- /app/node_modules
command: npm run start:dev
hostname: backend3
container_name: backend3
nginx:
redis:
image: redis/redis-stack
environment:
REDIS_ARGS: "--requirepass 1234"
REDISSEARCH_ARGS: "--requirepass 1234"
REDIS_HOST: redis
REDIS_USERNAME: default
REDIS_PASSWORD: 1234
REDIS_DATABASE_NAME: 0
REDIS_PORT: 8001
volumes:
- ./local-data/:/data
ports:
- "6379:6379"
- "8001:8001"
Notice we included an environment variable for each instance called INSTANCE_NAME. This will be used later so we know which instance of our web server is handling the proxied request.
Let’s update our upstream block in our nginx.conf file to include the two other server instances, making them 3:
worker_processes 1;

events {
    worker_connections 1024;
    #
}
http {
    # ensures that the server includes the proper mimetypes when the response is sent back to the client
    include mime.types;
    upstream backend_cluster {
        # Define the backend servers using round-robin
        server backend1:3000;
        server backend2:3000;
        server backend3:3000;
    }
    server {
        # server block
        }
    }
}
Before we start our fleet of services, we need to do a few things. Let’s start by updating the app.module.ts file to use the Redis storage module:
import { Module } from "@nestjs/common";
import { AppService } from "./app.service";
import {
minutes,
seconds,
ThrottlerGuard,
ThrottlerModule,
} from "@nestjs/throttler";
import { APP_GUARD } from "@nestjs/core";
import { AppController } from "./app.controller";
import { Injectable } from "@nestjs/common";
import { ThrottlerStorageRedisService } from "@nest-lab/throttler-storage-redis";
@Module({
imports: [
ThrottlerModule.forRoot({
throttlers: [
{
name: "second",
ttl: seconds(10),
limit: 4,
},
],
errorMessage: "too many requests! on " + process.env.INSTANCE_NAME,
storage: new ThrottlerStorageRedisService(
`redis://default:1234@host.docker.internal:6379/0`
),
}),
],
controllers: [AppController],
providers: [
AppService,
{
provide: APP_GUARD,
useClass: ThrottlerGuard,
},
],
})
export class AppModule {}
We included a connection string to connect to Redis. The username and password fields are hardcoded here; they match those specified in the REDIS_ARGS: --requirepass 1234 and the REDIS_USERNAME default in our docker-compose.yaml file.
Also, we temporarily disabled all the other throttle options except the one named second. For now, the user is limited to four requests every 10 seconds and will be blocked for 10 seconds if they exceed the limit.
We also modified the error message to include the INSTANCE_NAME environment variable to know which instance the client is blocked on.
So that we know which server responds when we hit each endpoint, let’s now update our app.controller.ts file:
import { Controller, Get } from "@nestjs/common";
import { SkipThrottle, Throttle } from "@nestjs/throttler";
@Controller("app")
export class AppController {
@Get("/a")
getA(): string {
return "this is A on " + process.env.INSTANCE_NAME;
}
@Get("/b")
getB(): string {
return "this is B on " + process.env.INSTANCE_NAME;
}
@Get("/b")
getC(): string {
return "this is C on " + process.env.INSTANCE_NAME;
}
}
We appended the INSTANCE_NAME environment variable to each endpoint response string to know which of our backend instances is responding to our request.
Let’s rebuild our images and restart our fleet of services again by running:
docker compose up -d --build
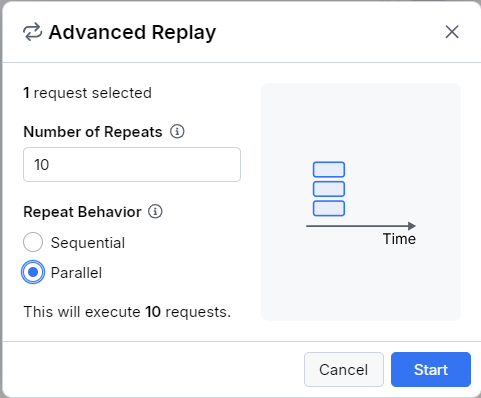
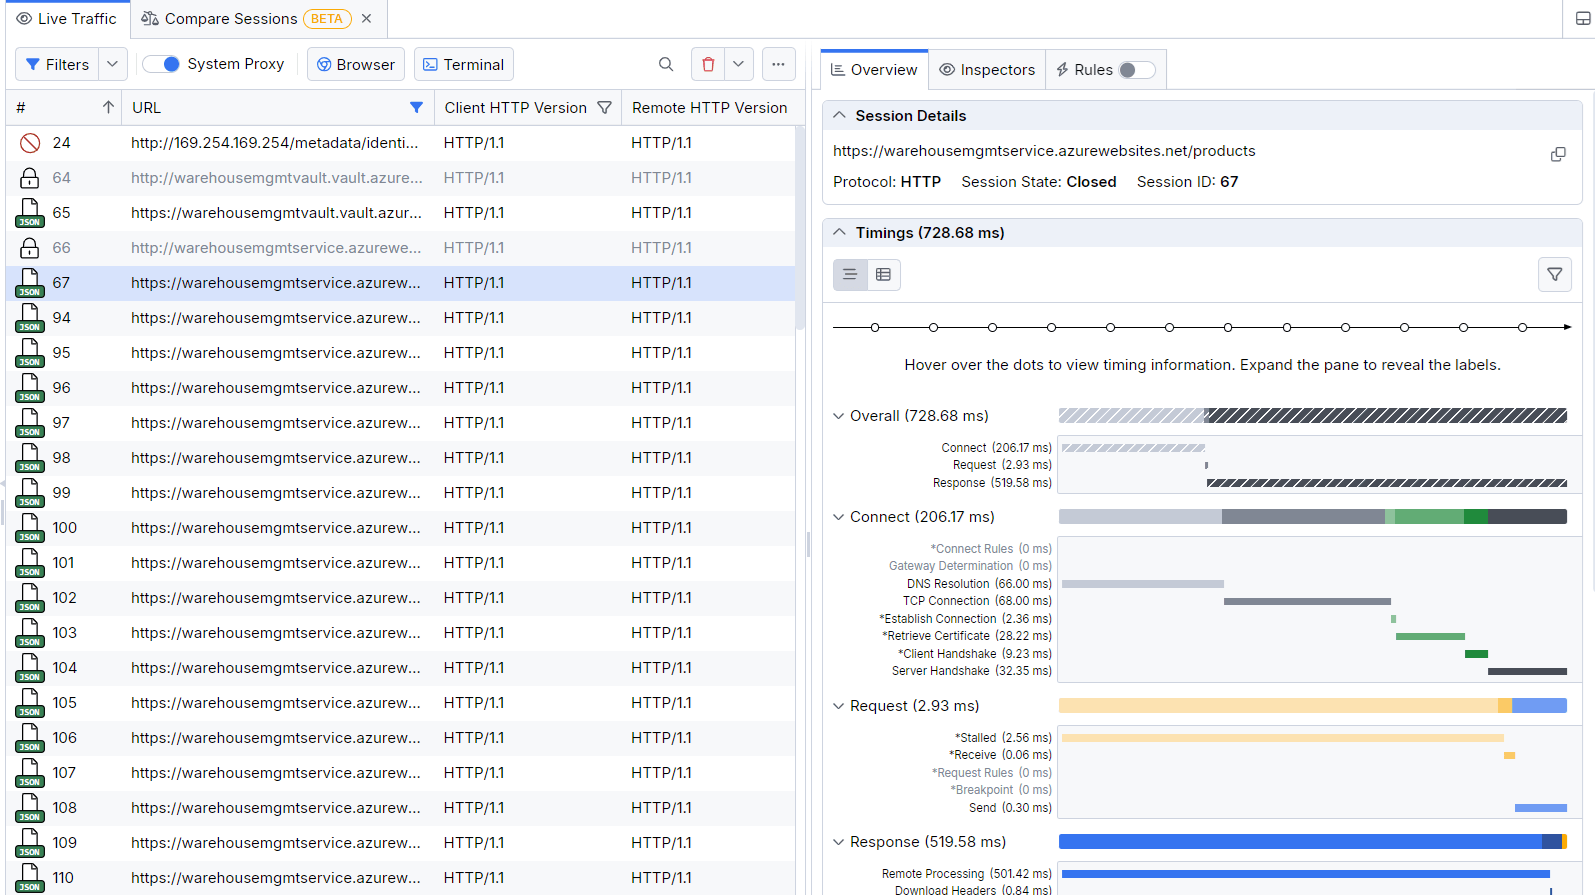
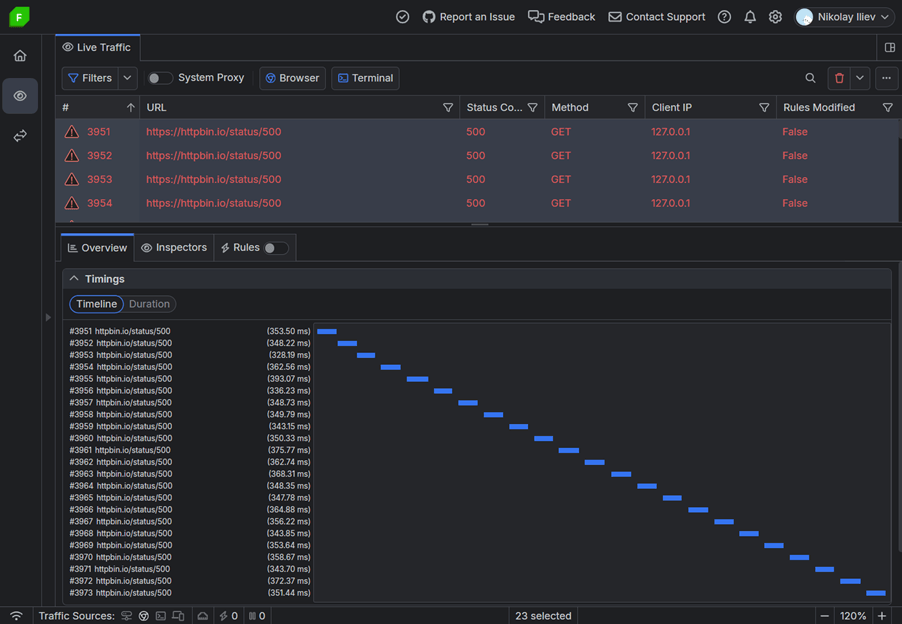
Now, when we hit our reverse proxy at localhost:8080/app/a:

Based on our throttle options definition, we defined limits that restrict the client to four requests every 10 seconds, and will be blocked for 10 seconds if they exceed the limit. Notice in the image above that when the limit is exceeded, the client is blocked across all instances.
Conclusion
Rate limiting helps force clients to consume resources responsibly. This guide shows us how we can use this technique to secure our web server and its resources from abuse.
 ]]>
]]>